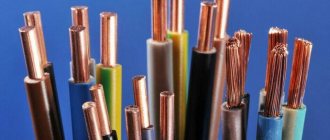
For cable lines (CL) of all voltage classes during design, construction, reconstruction, technical re-equipment and operation, it is recommended to use the following cables:
- with an increased thickness of the shell of increased hardness to reduce the risk of damage to the shell during laying;
- with an outer electrically conductive layer, including as part of a fire-retardant coating, applied after laying the cable to its shell, made of low-flammability materials, including polyvinyl chloride compositions with low smoke and gas emissions and without halogen compositions with a high oxygen index for laying in engineering structures;
- with cross-linked polyethylene insulation to replace oil-filled cables and cables with impregnated paper insulation;
- voltage 110 – 500 kV, which have passed the “Prequalification test of the cable system” for reliability in accordance with GOST R IEC 62067-2011, and voltage 6 – 35 kV, meeting the requirements of IEC 60502-2, IEC 60502-4 and harmonized HD 620 S2:2010 and HD 605 S2;
- for underwater installation - armored cables (armored non-magnetic) with cross-linked polyethylene insulation ensuring operation during the service life, withstanding axial, transverse, mechanical loads under conditions of hydrostatic pressure (only a single construction long underwater part of the cable line transition);
- for laying in mountainous areas, as well as in zones of seismic activity, use armored cables with cross-linked polyethylene insulation and lay them in special engineering structures. The installation method is determined by the design, using special measures to protect against mechanical damage.
- When laying parallel power cables 110-500 kV and fiber-optic cables for technological protection of substations and power lines, the fiber-optic cables should be laid outside trays with power cables or protective structures of power cables.
For cable lines of 110 kV and above with a length of at least 0.5 km, as a rule, cables with built-in optical fiber should be used to monitor the heating temperature of the current-carrying core. The service life of the cables is at least 30 years, taking into account operational measures regulated by the relevant regulatory documents.
CL equivalent circuits and their parameters
Typically, power lines are considered as lines with parameters evenly distributed along its length. In engineering calculations for cable power lines (CL) with a length of less than 10–50 km, simplified T- and U-shaped equivalent circuits with lumped parameters are usually used. In this case, the errors in the electrical calculation of the line practically depend only on its length. The choice of power line equivalent circuit is determined by the complexity of the power supply system. When calculating complex power supply systems on a computer, it is advisable to use a U-shaped equivalent circuit in order to simplify the calculations. Equivalent circuits of CLs with lumped parameters are shown in Fig. 1.
It is generally accepted to distinguish longitudinal elements in equivalent circuits - the resistance of the power line: ? = ? + ?? and transverse elements - conductivity: ? = ? + ??. The values of the indicated parameters for CL are determined by the general expression P = P0?, where P0{?0, ?0, ?0, ?0} is the value of the longitudinal or transverse parameter per 1 km of line; ? — length of the power transmission line (linear parameters).
In particular cases, depending on the design of the cable line and the voltage class, only the dominant parameters are used, depending on their physical manifestation.
Rice. 1. CL equivalent circuits with lumped parameters : T - shaped (a) and P - shaped (b)
Active resistance causes heat loss and depends on the material of the current-carrying cable cores and their cross-section. For CLs with small-section wires made of non-ferrous metals, the active resistance is taken to be equal to ohmic, since the manifestation of the surface effect at industrial frequency in this case does not exceed 1%. For wires with a cross-section of more than 500 mm2, the phenomenon of skin effect at power frequency is significant.
Linear active resistance of the cable line (Ohm/km) is determined by the formula
where ρ is the specific active resistance of the wire metal, Ohm ∙ mm2⁄km:
- for technical aluminum, depending on its grade, you can take ρ = 29.5 ÷ 31.5 Ohm ∙ mm2⁄km,
- for copper ρ = 18.0 ÷ 19.0 Ohm ∙ mm2⁄km;
? – cross-section of the phase wire (core), mm2.
It must be remembered that the active resistance of the current-carrying core of the power cable also depends on the ambient temperature (the cable line is laid in the ground, in the air, in pipes, etc.) and the value of the current flowing through the wire. The dependence of active resistance on wire temperature t is determined by the relation
where ?20 is the standard value of resistance ?0, which is calculated by the relation ?0 = ρ⁄?, at a conductor temperature ? = 20℃;
α is the temperature coefficient of electrical resistance, 1/deg (for copper and aluminum wires, the value is α = 0.00403).
The inductive reactance of the current-carrying core of a power cable X, as for an overhead line, is caused by the magnetic field that arises inside and around the conductor when alternating current flows through it. A self-inductive emf is induced in the conductor and is directed, in accordance with the Lenz principle, opposite to the emf of the source. Inductive reactance? due to current frequency ω = 2π? and the value of the phase inductance ?.
It is known that the inductive reactance of the phases of multiphase power lines also depends on the relative position of the phase wires (cores). In addition to the self-induction EMF in each phase, a counteracting EMF of mutual induction is induced, the value of which in each phase depends on the design of the power line. When the phase wires are brought closer together, the influence of the mutual inductive emf increases, which leads to a decrease in inductive reactance. Therefore, the inductive reactance of cable lines is 3 to 5 times less than the same parameter for overhead lines.
Inductive reactance, Ohm/km, per 1 km of cable line, at a current frequency of 50 Hz and a cyclic frequency ω = 2π? = 314 rad/ wires made of non-ferrous metals is determined similarly to an overhead line using an empirical formula as the sum of external ?́0 and internal ?̈0 inductive reactances. External inductive reactance is determined by the external magnetic flux formed around the wires and the values of Dav and ?pr (the geometric mean distance between the phase conductors and the radius of stranded wires, respectively).
Internal inductive reactance is determined by the internal flux that closes in the wires.
When making calculations, unlike overhead power lines (OHL), factory data on the inductive reactance of the cables is usually used, since the consumer does not have information about the design features of the cables (in particular, the parameters of conductive screens). For cable lines of all brands and cross-sections with a voltage of 0.38 - 10 kV, the inductive reactance is in the range of 0.06 - 0.10 Ohm/km and is determined from tables of physical and technical data of cables.
From the above it follows that the active resistance of the cable line depends on the material, cross-section and temperature of the wire. The dependence ?0 = ?(?) is inversely proportional to the cross-section of the wire, is clearly expressed at small cross-sections, when ?0 has large values, and is little noticeable at large cross-sections of the wires. The inductive reactance of cable lines of all brands and cross-sections with a voltage of 0.38 - 10 kV is in the range of 0.06 - 0.10 Ohm/km and is determined from tables of physical and technical data of cables.
Capacitive conductivity is caused by capacitances between phases, phase wires (cores) and ground (Fig. 2). In practical calculations, the working capacity of a three-phase overhead line (OHL) or cable power line (CL) with one wire in phase per unit length, F/km, is determined by the formula:
Numerical data for the working capacitance value ?0 ∙ 10−6, three-core power cables with belt insulation, F/km, voltage 0.4 - 10 kV are given in table. 1. Capacitive conductivity ?0 of a cable line, S/km, depends on the cable design and is indicated by the manufacturer, but for approximate calculations it can be estimated using the formula: .
Table 1. Values of working capacitance ?0 ∙ 10−6 three-core cables with belt insulation
| Voltage, kV | Core cross-section, mm2 | ||||||||||
| 10 | 16 | 25 | 35 | 50 | 70 | 95 | 120 | 150 | 185 | 240 | |
| Up to 1 kV | 0,35 | 0,40 | 0,50 | 0,53 | 0,63 | 0,72 | 0,77 | 0,81 | 0,86 | 0,86 | — |
| 6 | 0,20 | 0,23 | 0,28 | 0,31 | 0,36 | 0,40 | 0,42 | 0,46 | 0,51 | 0,53 | 0,58 |
| 10 | — | — | 0,23 | 0,27 | 0,29 | 0,31 | 0,32 | 0,37 | 0,44 | 0,45 | 0,60 |
Rice. 2. Capacities of three-phase cable power line
Under the influence of voltage applied to the cable line, capacitive (charging) currents flow through the line capacitances. Calculated value of capacitive current per unit length, kA/km
The charging power of the cable line, due to the current ??0, is determined by the voltage at each point of the line
The value of charging power for the entire cable line, length L, is determined through the actual (calculated) voltages of the beginning and end of the line, Mvar:
The same power can be determined approximately by the rated line voltage
Where ?? = ?0 ∙ ? — capacitive conductivity of the cable line, length L, cm;
?nom - rated voltage of the cable line, kV.
For cables with a voltage of 6 – 35 kV with paper insulation and viscous impregnation, the generation of reactive power ?0 per kilometer of line is known (see Table 2), taking into account which the total generation of cable lines can be determined by the relation:
Active conductivity of the CL is caused by active power losses ∆?? due to imperfect insulation. Specific conductivity ?0 is determined by the general formula for a shunt, S/km
In a cable line, under the influence of the greatest tension, there is a layer of belt insulation at the surface of the cable cores. The higher the operating voltage of the cable, the more noticeable are the leakage currents through the insulation material and the violation of its dielectric properties (an increase in the dielectric loss tangent tgδ).
Table 2. Design characteristics of three-core paper-insulated cables
| Nominal cross-section, mm2 | Active resistance lived under temperature 20℃ | Specific inductive resistance ?0, Ohm/km | Specific capacitance power ?0, kvar/km | ||||||||
| aluminum | copper | Rated cable voltage, kV | |||||||||
| Up to 1 | 6 | 10 | 20 | 35 | 6 | 10 | 20 | 35 | |||
| 10 | 3,10 | 1,84 | 0,073 | 0,110 | 0,122 | — | — | 2,3 | — | — | — |
| 16 | 1,94 | 1,15 | 0,0675 | 0,102 | 0,113 | — | — | 2,6 | 5,9 | — | — |
| 25 | 1,24 | 0,74 | 0,0662 | 0,091 | 0,099 | 0,135 | — | 4,1 | 8,6 | 24,8 | — |
| 35 | 0,89 | 0,52 | 0,0637 | 0,087 | 0,095 | 0,129 | — | 4,6 | 10,7 | 27,6 | — |
| 50 | 0,62 | 0,37 | 0,0625 | 0,083 | 0,090 | 0,119 | — | 5,2 | 11,7 | 31,8 | — |
| 70 | 0,443 | 0,26 | 0,0612 | 0,080 | 0,086 | 0,116 | 0,137 | 6,6 | 13,5 | 35,9 | 86 |
| 95 | 0,326 | 0,194 | 0,0602 | 0,078 | 0,083 | 0,110 | 0,126 | 8,7 | 15,6 | 40,0 | 95 |
| 120 | 0,258 | 0,153 | 0,0602 | 0,076 | 0,081 | 0,107 | 0,120 | 9,5 | 16,9 | 42,8 | 99 |
| 150 | 0,206 | 0,122 | 0,0596 | 0,074 | 0,079 | 0,104 | 0,116 | 10,4 | 18,3 | 47,0 | 112 |
| 185 | 0,167 | 0,099 | 0,0596 | 0,073 | 0,077 | 0,101 | 0,113 | 11,7 | 20,0 | 51,0 | 115 |
| 240 | 0,129 | 0,077 | 0,0587 | 0,071 | 0,075 | — | — | 13,0 | 21,5 | 52,8 | 119 |
| 300 | 0,105 | 0,062 | — | 0,063 | 0,066 | — | — | — | — | 57,6 | 127 |
| 400 | 0,078 | 0,047 | — | — | — | 0,092 | — | — | — | 64,0 | — |
Active conductivity of power cable per unit length, S/km. is equal to:
and the corresponding leakage current in the cable insulation:
Where ?? = ?0?.
Then the dielectric losses in the cable insulation material, MW, which must be taken into account for cable lines with a rated voltage of 110 kV and above, can be determined by the relationship:
Where ? = ?0? = ω?0? ∙ tgδ – active conductivity of the CL, taking into account its length.
Characteristics of communication lines
Network performance and reliability directly depend on the characteristics of communication lines.
The characteristics of communication lines can be divided into two groups:
- propagation parameters characterize the process of propagation of a useful signal depending on the line’s own parameters, for example, the linear inductance of a copper cable;
- influence parameters describe the degree of influence of other signals on the useful signal - external interference, interference from other pairs of conductors in the copper cable.
In turn, in each of these groups, primary and secondary parameters can be distinguished. Primary - characterize the physical nature of the communication line: for example, linear active resistance, linear inductance, linear capacitance and linear conductivity of copper cable insulation or the dependence of the refractive index of an optical fiber on the distance from the optical axis. Secondary parameters express some generalized result of the process of signal propagation along a communication line and do not depend on its nature - for example, the degree of attenuation of the signal power when it passes a certain distance along the communication line, the so-called signal attenuation. For copper cables, such a secondary influence parameter as the degree of attenuation of interference from an adjacent twisted pair is no less important.
Secondary parameters are determined by the response of the transmission line to some reference influences. This approach makes it possible to quite simply and uniformly determine the characteristics of communication lines of any nature, without resorting to complex theoretical studies and the construction of analytical models. To study the response of communication lines, sinusoidal signals of various frequencies are most often used as reference signals.
SPECTRAL ANALYSIS OF SIGNALS ON COMMUNICATION LINES
Any periodic process can be represented as a sum of sinusoidal oscillations of different frequencies and different amplitudes (see Figure 1). Each component of a sine wave is also called a harmonic, and the set of all harmonics is called a spectral decomposition of the original signal. Non-periodic signals can be represented as an integral of sinusoidal signals with a continuous frequency spectrum.
| Figure 1. Representation of a periodic signal as a sum of sinusoids. |
When transmitted over a communication line, the signal shape is distorted due to unequal deformation of sinusoids of different frequencies. If this is an analog signal transmitting speech, then the timbre of the voice changes due to inaccurate reproduction of overtones - side frequencies. When transmitting pulsed signals, typical for computer networks, low-frequency and high-frequency harmonics are distorted, as a result, the pulse fronts lose their rectangular shape (see Figure 2). Therefore, signals may be poorly recognized at the receiving end of the line.
| Figure 2. Pulse distortion in the communication line. |
When transmitted over a communication line, signals are distorted due to the fact that its physical parameters differ from ideal ones. For example, copper wires always represent some combination of active resistance, capacitive and inductive load distributed along the length. As a result, for sinusoids of different frequencies the line will have different impedances, which means they will be transmitted differently. Fiber optic cable also has deviations from the ideal medium for transmitting light—vacuum. If the communication line includes intermediate equipment, then it can introduce additional distortions.
Not only the heterogeneity of the internal physical parameters of the communication line causes inaccurate signals, external noise also contributes to the distortion of the signal shape at the line output. They are created by various electric motors, electronic devices, atmospheric phenomena, etc. Despite the protective measures taken by the developers of cables and amplifying-switching equipment, it is not possible to completely compensate for the influence of external interference. In addition, there is also internal interference in the cable - the so-called interference from one pair of conductors to another. As a result, the signals at the output of a communication line usually have a complex shape (as shown in Figure 2), from which it is sometimes difficult to understand what discrete information was supplied to the input of the line.
The quality of the original signals (the steepness of the edges, the general shape of the pulses) depends on the quality of the transmitter generating signals into the communication line. One of the most important characteristics of a transmitter is spectral, i.e. spectral decomposition of the signals generated by it. To generate high-quality rectangular pulses, it is necessary that the spectral response of the transmitter be as narrow a band as possible. For example, laser diodes have a significantly smaller emission spectrum width (1-2 nm) compared to LEDs (30-50 nm) when generating pulses, so the modulation frequency of laser diodes can be much higher than LEDs.
DAMPING AND WAVE RESISTANCE
The degree to which sinusoidal signals are distorted by communication lines is assessed using characteristics such as attenuation and bandwidth.
Attenuation shows how much the power of the reference sinusoidal signal at the output of a communication line decreases in relation to the signal power at the input of this line. Attenuation A is usually measured in decibels (dB) and is calculated using the following formula:
A = 10 lg Pout/Pin,
where Pout is the signal power at the line output, and Pin is the signal power at its input.
In the absence of intermediate amplifiers, the power of the cable output signal is always less than the input power, so the cable attenuation, as a rule, has a negative value.
The degree of attenuation of the power of a sinusoidal signal as it passes through a communication line usually depends on the frequency of the sinusoid, so a complete characteristic is given only by the dependence of the attenuation on frequency over the entire range used in practice (Figure 3).
| Figure 3. Attenuation versus frequency. |
Attenuation is a generalized characteristic of a communication line, since it allows us to judge not the exact shape of the signal, but its power (the integral result of the signal shape). In practice, attenuation is an important attribute in the description of communication lines: in particular, in cable standards this parameter is considered one of the main ones.
Most often, when describing the parameters of a communication line, attenuation values are given at just a few points of the general dependence, with each of them corresponding to a specific frequency at which attenuation is measured. The individual value of attenuation is called the attenuation coefficient. The use of just a few values instead of a complete characteristic is associated, on the one hand, with the desire to simplify measurements when checking the quality of the line, and on the other, the fundamental frequency of the transmitted signal is often known in advance - this is the frequency whose harmonic has the greatest amplitude and power. Therefore, it is enough to know the level of attenuation at a given frequency in order to approximately estimate the distortion of the signals transmitted along the line. More accurate estimates are possible with knowledge of the attenuation at various frequencies corresponding to several fundamental harmonics of the transmitted signal.
The lower the attenuation, the higher the quality of the communication line or cable through which it is laid. Typically, attenuation is determined for passive sections of a communication line, consisting of cables and cross sections, without amplifiers and regenerators. For example, Category 5 indoor twisted pair cable, used for virtually all LAN technologies, has an attenuation of at least -23.6 dB at 100 MHz over a cable length of 100 m.
The frequency of 100 MHz was chosen because cable in this category is intended for high-speed data transmission whose signals have significant harmonics with a frequency of approximately 100 MHz. A higher-quality Category 6 cable already has an attenuation of at least -20.6 dB at a frequency of 100 MHz, i.e. the signal power decreases to a lesser extent. Documentation often gives absolute values of attenuation, i.e. its sign is omitted, since attenuation is always negative for a passive line section that does not contain amplifiers and regenerators, for example, a continuous cable.
| Figure 4. Optical fiber transparency windows. |
Optical cable is characterized by significantly lower (in absolute value) attenuation rates, usually in the range from 0.2 to 3 dB for a cable length of 1000 m. Almost all optical fibers have a complex dependence of attenuation on wavelength, with three so-called “transparency windows” " A typical example is shown in Figure 4. As you can see, the area of effective use of modern fibers is limited to wavelengths of 850, 1300 and 1550 nm, while the 1550 nm window provides the lowest losses, and therefore the maximum range at a fixed transmitter power and fixed receiver sensitivity. The produced multimode cable has the first two transparency windows, i.e. 850 and 1300 nm, and the single-mode cable has two transparency windows in the ranges of 1310 and 1550 nm.
Transmitter power is often characterized by the absolute level of signal power. Power level, like attenuation, is measured in decibels. In this case, the base value is 1 mW. Therefore, the power level p is calculated using the following formula:
p = 10 log P/1 mW [dBm],
where P is the signal power in milliwatts and dBm is the unit of power level (dB per mW).
An important secondary parameter for the propagation of a copper communication line is its characteristic impedance. This parameter represents the total (complex) resistance that an electromagnetic wave of a certain frequency encounters when propagating along a homogeneous circuit. Characteristic impedance is measured in Ohms and depends on such primary parameters of the communication line as active resistance, linear inductance and linear capacitance, as well as on the frequency of the signal itself. The output impedance of the transmitter must be matched to the characteristic impedance of the line, otherwise the signal attenuation will be excessively large.
INTERFERENCE IMMUNITY
The noise immunity of a line determines its ability to reduce the level of interference from the external environment or the conductors of the cable itself. It depends on the type of physical medium used, on the shielding and interference suppression means of the line itself. Radio lines are the least resistant to interference; cable lines have good resistance and fiber optic lines, which are insensitive to external electromagnetic radiation, have excellent resistance. Typically, interference from external electromagnetic fields is reduced by shielding and/or twisting of conductors. The quantities characterizing noise immunity refer to the parameters of the influence of the communication line.
The primary parameters of the influence of copper cable are electrical and magnetic connections. Electrical coupling is determined by the ratio of the induced current in the affected circuit to the voltage in the influencing circuit. Magnetic coupling is the ratio of the electromotive force induced in the influenced circuit to the current in the influencing circuit. The result of electrical and magnetic coupling will be induced signals (crosstalk) in the affected circuit. The cable's resistance to interference is characterized by several different parameters.
Near End Cross Talk (NEXT) determines the stability of a cable when interference is caused by a signal generated by a transmitter connected to one of the adjacent pairs at the same end of the cable as the one connected to the affected cable. pair receiver. The NEXT indicator, expressed in decibels, is equal to 10 lg Pout/Pin, where Pout is the power of the output signal, Pin is the power of the induced signal. The lower the NEXT value, the better the cable. So, for Category 5 twisted pair cable, NEXT should be better than -27 dB at 100 MHz.
Far End Cross Talk (FEXT) describes a cable's immunity to interference when the transmitter and receiver are connected to different ends of the cable. Obviously, this indicator should be better than NEXT, since the signal reaching the far end of the cable is weakened due to attenuation in each pair.
The NEXT and FEXT indicators are usually used in relation to a cable consisting of several twisted pairs, when the mutual interference of one pair to another can reach significant values. For a single coaxial cable (i.e., consisting of one shielded core), such an indicator does not make sense; it does not apply to a double coaxial cable due to the high degree of protection of each core. Optical fibers also do not create any noticeable interference with each other.
Due to the fact that in some new technologies data transmission is carried out simultaneously over several twisted pairs, total indicators (PowerSUM, PS) - PS NEXT and PS FEXT - have recently begun to be used. They reflect the resistance of the cable to the total power of crosstalk on one of the cable pairs from all other transmitting pairs.
A very important characteristic of the transmission medium is the cable protection index (ACR), which is the difference between the levels of useful signal and interference. The higher this value, the potentially higher speed data can be transferred over the specified cable.
ACCURACY
The reliability of data transmission characterizes the probability of distortion for each transmitted bit of data. Sometimes this same indicator is called the bit error rate (BER). The BER value for communication channels without additional means of error protection (for example, self-correcting codes or protocols with retransmission of distorted frames) is, as a rule, 10-4-10-6, and in fiber-optic communication lines - 10-9. A data transmission confidence value of, for example, 10-4 indicates that on average, out of 10,000 bits, the value of one bit is misinterpreted.
Bit errors occur both due to the presence of noise on the line and due to distortion of the signal waveform due to the limited bandwidth of the line. Therefore, to increase the reliability of transmitted data, it is necessary to increase the degree of noise immunity of the line, reduce the level of crosstalk in the cable, and also use communication lines with a wider operating frequency band.
BANDWIDTH
Bandwidth is another secondary characteristic. On the one hand, it directly depends on attenuation, and on the other hand, it directly affects such an important indicator of the communication line as the maximum possible information transmission speed.
Bandwidth is a continuous range of frequencies for which the attenuation does not exceed a predetermined limit. In other words, the passband determines the range of frequencies of a sinusoidal signal at which this signal is transmitted over a communication line without significant distortion (frequencies are often taken as the limiting ones, where the power of the output signal is halved relative to the input, which corresponds to an attenuation of -3 dB) . As we will see below, bandwidth has the greatest influence on the maximum possible speed of information transfer along a communication line.
Thus, amplitude-frequency response, bandwidth and attenuation are universal characteristics, and their knowledge allows us to draw a conclusion about how signals of any shape will be transmitted through a communication line.
throughput
Throughput (the number of bits of information transmitted per unit of time) and reliability of data transmission (the probability of delivery of an undistorted bit or the probability of its distortion) are of primary interest to computer network developers, since these characteristics directly affect the performance and reliability of the created network.
The throughput and reliability of data transmission depend on both the characteristics of the physical medium and the method of data transmission. Therefore, it is impossible to talk about the throughput of a communication link until the physical layer protocol is defined. The throughput of a line characterizes the maximum possible data transfer rate over a communication line. It is measured in bits per second (bps), as well as in derived units - kilobits per second (Kbps), megabits per second (Mbps), gigabits per second (Gbps), etc.
The throughput of communication lines and communications network equipment is traditionally measured in bits per second rather than bytes per second. This is due to the fact that data in networks is transmitted sequentially, that is, bit by bit, and not parallel, by bytes, as happens between devices inside a computer. Units of measurement such as kilobit, megabit or gigabit in network technologies strictly correspond to powers of 10 (i.e. a kilobit is 1000 bits, and a megabit is 1,000,000 bits), as is customary in all branches of science and technology, and not close these numbers are powers of 2, as is customary in programming, where the prefix “kilo” is equal to 210 = 1024, and “mega” is 220 = 1,048,576.
The throughput of a communication line depends not only on its characteristics, such as attenuation and bandwidth, but also on the spectrum of the transmitted signals. If the significant harmonics of the signal (i.e., those harmonics whose amplitudes make the main contribution to the resulting signal) are within the bandwidth of the line, the signal will be transmitted well and the receiver will be able to correctly recognize the information sent over the line by the transmitter. If significant harmonics go beyond the bandwidth of the communication line, then the signal will become significantly distorted, the receiver will make mistakes when recognizing information, and the information itself will ultimately not be able to be transmitted with the given bandwidth.
INFORMATION ENCODING METHOD
The choice of method for representing discrete information in the form of signals supplied to the communication line is called physical, or linear, coding.
The spectrum of signals and the line capacity depend on the chosen encoding method. So, different encoding methods may correspond to different bandwidths. For example, a Category 3 twisted pair cable is capable of transmitting data with a throughput of 10 Mbps when encoding the 10BaseT physical layer standard and 33 Mbps when encoding the 100BaseT4 standard.
According to information theory, information is carried only by a distinguishable and unpredictable change in the received signal. Thus, receiving a sinusoid, in which the amplitude, phase and frequency remain unchanged, does not carry information, since a change in the signal, although it occurs, is easily predictable. Similarly, pulses on a computer clock bus do not carry information, since their changes are constant over time. But the pulses on the data bus cannot be predicted in advance, so they transfer information between individual blocks or devices of the computer.
Most coding methods use a change in any parameter of a periodic signal - frequency, amplitude and phase of a sinusoid, or the sign of the potential of a pulse sequence. A periodic signal whose parameters change is called a carrier signal or carrier frequency if a sinusoid is used as such a signal.
If the signal changes in such a way that only two of its states differ, then any change in it will correspond to the smallest unit of information - a bit. If a signal can have more than two distinguishable states, then any change in it contains several bits of information.
The number of changes in the information parameter of a periodic carrier signal per second is measured in baud. The period of time between adjacent changes in the information signal is called the transmitter operating cycle.
The line capacity in bits per second is generally not the same as the baud rate. It can be either higher or lower than the baud number, and this ratio depends on the encoding method.
When a signal has more than two distinguishable states, the throughput in bits per second will be higher than the baud rate. For example, if the information parameters are the phase and amplitude of a sinusoid (and four phase states are distinguished - at 00, 900, 1800 and 2700 and two signal amplitude values), then the information signal can have eight distinguishable states. In this case, a modem operating at 2400 baud (with a clock frequency of 2400 Hz) transmits information at a speed of 7200 bps, since three bits of information are transmitted per signal change.
When using signals with two distinguishable states, the opposite picture is possible. This often occurs because in order for the receiver to reliably recognize the user information, each bit in the sequence is encoded using several changes to the information parameter of the carrier signal. For example, when encoding a one bit value with a pulse of positive polarity, and a zero bit value with a pulse of negative polarity, the physical signal changes its state twice when transmitting each bit. With this encoding, the line capacity is two times lower than the number of bauds transmitted along the line.
Line throughput is affected not only by physical but also by logical coding. Performed before physical encoding, it involves replacing the bits of the original information with a new sequence of bits that carries the same information, but also has additional properties, in particular the ability for the receiving side to detect errors in the received data. Accompanying each byte of source information with one parity bit is a very commonly used logical encoding method when transmitting data using modems. Another example of logical coding is the encryption of data, which ensures its confidentiality when transmitted through public communication channels. With logical coding, most often the original sequence of bits is replaced by a longer sequence, so the channel capacity in relation to useful information decreases.
Natalya Olifer is a columnist for the Journal of Network Solutions/LAN. You can contact her at Victor Olifer - chief specialist of Uni Corporation. He can be contacted at
CL equivalent circuits for calculating symmetrical modes
When calculating symmetrical steady-state modes of an electric power system, an equivalent circuit is drawn up for one phase, i.e. longitudinal parameters of CL, resistance? = ? + ?? depicted and calculated for one phase wire (core).
Capacitive conductivity?? takes into account the conductivity (capacitance) between phases, between phases and ground and reflects the generation of charging power of the entire three-phase structure at the beginning and end of the line:
The active conductivity of line G, depicted as a shunt between the phase (residential) and the zero potential point of the circuit (ground), includes the total losses of active power to the corona (or insulation) of the three phases at the beginning and end of the line:
Transverse conductions (shunts) ? = ? + ??? (Fig. 3,c and 3,e) in equivalent circuits of cable power lines can not be depicted, but replaced with the powers of these shunts (Fig. 45,d).
For example, instead of active conductivity, active power losses in the cable line insulation are shown:
and instead of capacitive conductivity they indicate the generation of charging power
In cable lines with voltages up to 10 kV of small cross-sections (50 mm2 or less), active resistance is decisive, and in this case inductive reactances may not be taken into account (Fig. 3, a). Dielectric losses of cable lines with voltages up to 35 kV are insignificant and in calculations of electrical modes they are neglected and, accordingly, the active conductivity is assumed to be zero (Fig. 3, c).
Taking into account active conductivity is necessary for cable lines with voltages of 110 kV and higher in calculations that require calculation of electricity losses. In short local networks with rated voltages up to 35 kV, charging currents and powers are significantly less than load ones, therefore in cable lines, capacitive conductivity is taken into account only at line voltages of 20 and 35 kV.
The need to take into account inductive reactances also depends on the share of the reactive component of the current in the total electrical load. When analyzing electrical modes with low power factor (cos ? < 0.8), the inductive reactance of the cable line must be taken into account in order to avoid errors in determining voltage loss.
Rice. 3. Replacement diagrams for cable power transmission lines : a) – cable lines with voltage 0.38 – 10 kV of small sections; b) – cable lines with voltage 0.38 – 20 kV; c) – CL voltage 35 kV with capacitive conductivity; d) – CL voltage 35 kV with charging power instead of capacitive conductivity; e) – CL voltage 110 – 500 kV with transverse conductivity.
