Internal forces in tension and compression
When external influences are applied to a beam with a constant cross-section, the action of which in any cross-section is directed parallel to its central axis and perpendicular to the cross-section, the following type of deformation occurs to it: tension or compression. Based on the hypothesis about the principle of independence of external influences, for each of the cross sections, it is possible to calculate the internal force as the vector sum of all applied external influences. Tensile loads in strength materials are usually considered positive, and compressive loads negative.
Having considered an arbitrary section of a beam or rod, we can say that the internal stresses are equal to the vector sum of all external forces grouped along one of its sides. This is true only taking into account the Saint-Venant principle (French engineer A. Saint-Venant, 1797-1886) about softening the boundary conditions, because the distribution of internal forces over the cut surface is complex with nonlinear dependencies, but in this case the error value can be neglected as insignificant.
Using the Bernoulli hypothesis (Swiss mathematician, I. Bernoulli, 1667-1748) about plane sections, diagrams can be drawn to more clearly represent the processes of distribution of forces and stresses along the central axis of the beam. A visual representation is more informative and in some cases allows you to obtain the necessary values without complex calculations. The graphical representation reflects the most loaded areas of the rod; the engineer can immediately identify problem areas and limit calculations only to critical points.
All of the above can be applied under quasi-static (the system can be described statically) loading of a rod with a constant diameter. Using the example of a tensile rod, the potential energy of the system is determined by the formula:
U=W=FΔl/2=N²l/(2EA)
The potential tensile energy U is concentrated in the sample and can be equated to the work W done (the slight release of thermal energy can be attributed to the error) that was produced by the force F to increase the length of the rod by the value of the absolute elongation. Transforming the formula, we find that the value of the potential tension energy can be calculated by calculating the ratio of the square of the longitudinal force N multiplied by the length of the rod l and twice the product of the Young’s modulus E of the material by the cross-sectional value A.
As can be seen from the formula, the tensile energy always has a positive value; for it it is impossible to apply the hypothesis of the independence of the action of forces, because it is not a vector quantity. The unit of measurement is joule (J). At the bottom of the formula is the product EA - this is the so-called stiffness of the section; with a constant Young’s modulus, it grows only due to an increase in area. The value of the ratio of stiffness to the length of the beam is considered as the rigidity of the beam as a whole.
Compression resistance
There are three main directions of forces when compressing wood: 1) along the grain, 2) across the grain in the radial direction, and 3) across the grain in the tangential direction (Fig. 21). The value of temporary compressive strength in other directions takes intermediate values between the values corresponding to the main directions.
Compression resistance along the fibers
The relatively high tensile strength of wood when compressed along the grain determines the widespread use of compressed racks in various structures.
The limit of proportionality during compression along the fibers is very high. According to the Madison Laboratory (USA), the ratio of the proportionality limit to the temporary resistance is:
- for coniferous species 0.78
- for soft hardwood 0.77
- for hard deciduous 0.66
As humidity decreases, compressive strength increases.
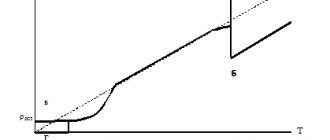
The curve of changes in temporary compressive strength of spruce depending on humidity is shown in Fig. 22. It can be seen from it that the strongest increase in tensile strength occurs in the range from 15% to an absolutely dry state.
Rice. 22. Diagram of the dependence of the compression resistance of spruce wood on humidity.
To determine the relationship between humidity and temporary resistance, there is an empirical formula:
σ15 = σ W [1+ α( W -15)],
where σ15 is the temporary resistance at 15% humidity, σW is the temporary resistance at humidity W, W is the wood moisture content in %, α is a coefficient depending on the type of wood.
Coefficients α for different breeds are given in table. 23.
Table 23 - Coefficient a, which determines the dependence of temporary compressive strength along the fibers on humidity
| Wood species | Coefficient α |
| Birch | 0,045 |
| Oak | 0,040 |
| Maple | 0,040 |
| Siberian larch | 0,050 |
| Pine | 0,050 |
| Ash | 0,050 |
For pine, Ayan spruce, common spruce, Caucasian fir and delta wood, the relationship between moisture content and temporary compressive strength along the fibers is more accurately determined by the formula:
σ15 = K σ W
where K is the conversion factor (given in Table 24).
The temporary compressive strength also depends on the volumetric weight of the wood. This relationship can be expressed as a straight line equation with parameters characteristic of different rocks (Table 25).
Table 24 Coefficient K for recalculating the temporary compressive strength along the wood fibers at different humidity values depending on σ15
| Humidity% | 0 | 1/4 % | 1/2 % | 3/4 % |
| 1. For pine | ||||
| 8 | 0,683 | 0,693 | 0,704 | 0,714 |
| 9 | 0,725 | 0,735 | 0,746 | 0,757 |
| 10 | 0,767 | 0,778 | 0,789 | 0,800 |
| 11 | 0,811 | 0,823 | 0,834 | 0,845 |
| 12 | 0,857 | 0,868 | 0,880 | 0,891 |
| 13 | 0,903 | 0,915 | 0,927 | 0,939 |
| 14 | 0,951 | 0,963 | 0,975 | 0,988 |
| 15 | 1,000 | 1,013 | 1,025 | 1,038 |
| 16 | 1,050 | 1,063 | 1,076 | 1,089 |
| 17 | 1,102 | 1,115 | 1,128 | 1,141 |
| 18 | 1,155 | 1,168 | 1,182 | 1,195 |
| 19 | 1,209 | 1,223 | 1,236 | 1,250 |
| 20 | 1,264 | — | — | — |
| 2. For common spruce and ayan spruce | ||||
| 8 | 0,749 | 0,757 | 0,764 | 0,771 |
| 9 | 0,779 | 0,786 | 0,794 | 0,802 |
| 10 | 0,810 | 0,818 | 0,826 | 0,835 |
| 11 | 0,843 | 0,852 | 0,860 | 0,869 |
| 12 | 0,878 | 0,888 | 0,897 | 0,906 |
| 13 | 0,916 | 0,926 | 0,936 | 0,946 |
| 14 | 0,956 | 0,967 | 0,978 | 0,989 |
| 15 | 1,000 | 1,012 | 1,023 | 1,035 |
| 16 | 1,047 | 1,059 | 1,072 | 1,085 |
| 17 | 1,098 | 1,111 | 1,125 | 1,138 |
| 18 | 1,152 | 1,167 | 1,182 | 1,197 |
| 19 | 1,212 | 1,229 | 1,245 | 1,261 |
| 20 | 1,277 | 1,295 | 1,313 | 1,330 |
| 3. For Caucasian fir | ||||
| 8 | 0,724 | 0,733 | 0,741 | 0,750 |
| 9 | 0,760 | 0,769 | 0,778 | 0,788 |
| 10 | 0,798 | 0,807 | 0,818 | 0,828 |
| 11 | 0,838 | 0,848 | 0,858 | 0,868 |
| 12 | 0,879 | 0,889 | 0,899 | 0,909 |
| 13 | 0,920 | 0,930 | 0,940 | 0,950 |
| 14 | 0,960 | 0,970 | 0,980 | 0,990 |
| 15 | 1,000 | 1,010 | 1,019 | 1,029 |
| 16 | 1,038 | 1,047 | 1,056 | 1,065 |
| 17 | 1,073 | 1,081 | 1,090 | 1,098 |
| 18 | 1,105 | 1,113 | 1,120 | 1.12T |
| 19 | 1,133 | 1,140 | 1,142 | 1,152 |
| 20 | 1,157 | — | — | — |
| 4. For delta wood | ||||
| 3 | 0,812 | 0,835 | 0,857 | 0,880 |
| 4 | 0,903 | 0,927 | 0,951 | 0,975 |
| 5 | 1,000 | 1,025 | 1,049 | 1,074 |
| 6 | 1,098 | 1,122 | 1,146 | 1,170 |
| 7 | 1,192 | 1,214 | 1,235 | 1,255 |
| 8 | 1,274 | — | — | — |
Table 25 Equations of the relationship between volumetric weight and temporary compressive strength (according to Vanin)
| Wood species | Dependency equation |
| Birch | σсж15=1700γ15-555 |
| Oak | σсж15=1285γ15-380 |
| Spruce | σсж15= 1000γ15-70 |
| Maple | σсж15=1200γ15-335 |
| Siberian larch | σсж155=740γ15+21 |
| Pine | σco15=1250γ15+25 |
| Ash | σco15=1400γ15+25 |
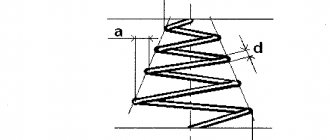
The inclination of the fibers relative to the direction of the acting forces has a great influence on the compressive strength (Fig. 23). A noticeable drop in resistance begins at an angle between the direction of the force and the direction of the fibers and 7-8°. As this angle is further increased to approximately 45°, the resistance drops sharply, after which the resistance curve decreases more slowly.
Rice. 23. Diagram of compression resistance versus fiber inclination. 1—in the tangential plane, 2—in the radial plane.
Rice. 24. The nature of wood destruction during compression.
In the radial plane, the line of compression failure along the fibers is usually directed perpendicular to the fibers, and in the tangential plane this line is directed at an angle to the direction of the fibers (Fig. 24). Wet wood, when destroyed by compression, produces a less rough and needle-like surface than dry wood, in which flakes and splitting of fibers occur.
The compressive resistance along the fibers is approximately two times less than the tensile resistance in the same direction.
Compression resistance across the grain
The resistance of wood to compression across the grain is less than a third of the resistance to compression along the grain for softwood (27%) and less than half (40%) for hardwood.
The average ratio between the compressive strength along the fibers σсж вд and across the fibers σсж р can be expressed by the relation σсж р = 0.36 σсж вд
The limit of proportionality during compression across the grain is very low for coniferous species (about 35% of the breaking load for pine) and quite high for deciduous species (70% of the breaking load for oak and birch).
Compression resistance across the fibers in the radial and tangential directions depends in hardwoods on the size of the pith rays and on the heterogeneity of the structure of the annual layers. In wood species where the pith rays are well developed (oak, beech, maple, birch), the resistance to radial compression is on average 1.5 times higher than the resistance to tangential compression. In deciduous wood with poorly developed core rays, the resistance to compression in the radial and tangential directions is approximately the same.
In coniferous species, the opposite phenomenon is observed: the compression resistance in the tangential direction is 1.5 times higher than the resistance in the radial direction.
The effect of humidity on the resistance of wood to compression across the grain is also quite significant. The correction factor for pine when compressed in the tangential direction is 4.5% and in the radial direction 3.5% per 1% moisture content.
For deciduous species, the correction factor is much higher and . on average it is taken at 6%. In both cases, increased humidity reduces compression resistance.
- DIY furniture reupholstery
Tensile and compressive stresses
Using Bernoulli's hypothesis for the longitudinal elastic deformation of a rod, it is possible to define the longitudinal force N as the resultant of all internal forces distributed over the section. Bernoulli's hypothesis, together with the hypothesis of non-pressure of the fibers, allows us to say that σ at an arbitrary point of the cut will be constant, because the reaction of the longitudinal fibers is the same throughout the entire cross section. To determine the value of normal stress σ, the following formula is used:
The stress for an elastically deformed rod is described as the ratio of the internal force N to the cross-sectional area A. It is considered positive in tension, and negative in compression.
The absolute deformation depends on the rigidity of the section, the magnitude of the longitudinal force and the length of the beam. The dependence can be described using the following formula:
Δl=Nl/EA
Thus, the method for calculating the magnitude of the absolute change in length is as follows: it is necessary to calculate the ratio of the value of the longitudinal force N multiplied by the length of the rod l and the section stiffness (the product of Young’s modulus E and the cross-sectional area A).
In real calculations, quite a lot of multidirectional forces act on a beam; solving such problems requires constructing diagrams that can clearly show what stresses act in different areas, what causes deformation during tension and compression.
Within the framework of such a quasi-static (conditionally static) system such as a beam or rod with a variable cross-section or hole, the potential tensile energy can be considered as the sum of the energies of homogeneous sections. When carrying out calculations, it is important to correctly divide the rod into sections and model all the forces and stresses involved in the process. For real calculations, constructing diagrams is a complex task that requires the engineer to have a good understanding of the loads acting on the part. For example, a shaft with pulleys of different diameters requires first identifying critical points and dividing them into corresponding sections, then constructing graphs based on them.
Compression of brittle material
After measurement, a cylindrical cast iron sample (ho/do=1.5) is placed between the press plates and subjected to static loading. The compression diagram will have the form shown in Fig. 2. It is easy to notice that there is no straight section on the compression diagram. Fracture occurs suddenly under load Pmax with the appearance of a series of oblique cracks directed at approximately 45° to the axis of the sample. This nature of destruction is explained by the action of tangential stresses that arise in inclined areas during compression.
Fig. 2 Compression diagram and fracture pattern of cast iron samples
Thus, when brittle materials are compressed and stretched, only the tensile strength can be determined
The difference between the compression and tension diagrams of cast iron is only that the load corresponding to the ultimate compressive strength is 3-5 times higher than the load corresponding to the ultimate tensile strength, and accordingly (σв)с > (σв)р, i.e. . Cast iron resists compression better than tension.
The nature of the sample deformation and the reasons for its destruction for a brittle material largely depend on the influence of friction forces between the sample and the supporting surfaces of the machine. By periodically lubricating the ends of the sample with paraffin during testing, frictional forces can be almost completely eliminated. In this case, the sample does not take a barrel-shaped shape throughout the entire test, remains cylindrical and collapses along planes parallel to the center plane of the sample due to unacceptably large tensile deformations.
Tensile and compressive strains
When stretching/compressing a beam, 2 types of deformation can occur. The first is elastic, the second is plastic. Elastic deformation is characterized by restoration of the original parameters after the cessation of the impact. In the case of the plastic stage of deformation of the material, it loses and does not restore its shape and size. The magnitude of the impact for the transition of one type to another is called the yield strength.
To calculate the tensile displacement of a beam or rod, the method of dividing it into sections within which external influences are applied should be used. At the points where the force is applied, the magnitude of the change in length should be calculated using the formula: Δl=Nl/EA. As you can see, it depends on the rigidity of the section, the length of the beam or rod and the magnitude of the acting longitudinal force. The final displacement for the beam as a whole will be the sum of all partial displacements calculated for the points of application of force.
Transverse deformations of the beam (becomes thicker during compression and thinner during tension) are also characterized by the absolute and relative magnitude of the deformation. The first is the difference between the section size after and before the application of external influences, the second is the ratio of the absolute deformation to its original size. Poisson's ratio, which reflects the linear dependence of longitudinal and transverse deformations, determines the elastic properties of materials and is considered unchanged for tension and compression. Longitudinal ones most clearly reflect the processes occurring in a beam or rod under external influence. Knowing the value of any of them (longitudinal or transverse) and using Poisson's ratio, you can calculate the value of the unknown.
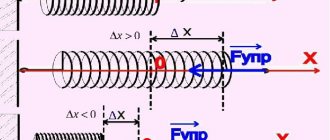
To determine the amount of deformation of a spring during tension, you can apply Hooke's law for springs:
F=kx
In this case, x is the increase in the length of the spring, k is the stiffness coefficient (unit N/m), F is the elastic force directed in the direction opposite to the displacement. The magnitude of the absolute deformation will be equal to the ratio of the elastic force to the stiffness coefficient. The stiffness coefficient determines the elastic properties of the material used for manufacturing; it can be used to select the manufacturing material under the conditions of solving a specific problem.