Why do you need to know the mechanical properties of metals?
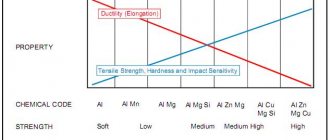
Main types of pure metals
Metals belong to chemical elements and substances that are characterized by high thermal conductivity and are mostly hard. Under the influence of high temperatures, plasticity increases and they have malleability. These characteristics of materials allow them to be processed in various ways.
Metal materials and their alloys are characterized by a number of indicators: chemical, mechanical, physical and operational. Taken together, they make it possible to determine the actual characteristics in full. It is impossible to single out the most important of them. But to solve certain problems, more attention is paid to a specific group of properties.
The mechanical properties of metals need to be known to solve the following questions:
- production of a product with certain qualities;
- selection of the optimal processing process for the workpiece;
- the influence of the mechanical characteristics of metal materials on the performance properties of the product.
Various methods are used to determine specific mechanical properties. Testing of metals and alloys is carried out using special instruments. This is done in a laboratory setting. To achieve accurate results, it is recommended to use the results of research from government metrology organizations.
Mechanical properties determine the resistance of a material to external forces. For each parameter there are certain numerical indicators.
Mechanical properties of materials,
a set of indicators characterizing the resistance of a material to the load acting on it, its ability to deform in this case, as well as the features of its behavior during the process of destruction.
In accordance with this M. s. m are measured by stress (usually in kgf/mm2
or
Mn/m2
)
,
strain (in%), specific work of deformation and fracture (usually in
kgf
×
m/cm2
or
Mj/m2
)
,
the rate of development of the destruction process under static or repeated load (most often in
mm
per 1
sec
or per 1000 load repetition cycles,
mm/kcycle
)
.
M. s. m are determined during mechanical tests of samples of various shapes.
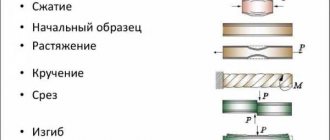
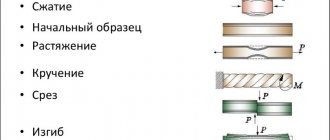
In general, materials in structures can be subjected to loads of very different nature ( Fig. 1
): work in
tension,
compression,
bending
,
torsion
, shear, etc. or are subject to the combined action of several types of load, such as tension and bending.
The operating conditions of materials are also varied in temperature, environment, speed of load application and the law of its change over time. In accordance with this, there are many indicators of M. s. m. and many mechanical testing methods. For metals and engineering plastics, the most common tests are tensile, hardness
, and impact bending; brittle structural materials (for example, ceramics, metal-ceramics) are often tested for compression and static bending; It is important to evaluate the mechanical properties of composite materials, in addition, during shear tests.
Deformation diagram.
A load applied to a sample causes its
deformation
.
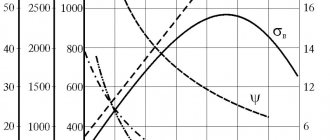
The relationship between load and deformation is described by the so-called. strain diagram ( Fig. 2
).
Initially, the deformation of the sample (under tension - the increment in length Dl )
is proportional to the increasing load
P
, then at point
n
this proportionality is violated, however, to increase the deformation, a further increase in the load
P
;
when D l
> D
l
in, deformation develops without applying external force, with a gradually decreasing load. The appearance of the strain diagram does not change if stress is plotted along the ordinate axis
and along the x-axis - relative elongation
(F0
and
l0
are the initial cross-sectional area and the estimated length of the sample, respectively).
The resistance of materials is measured by stresses characterizing the load per unit cross-sectional area of the sample
in kgf/mm2.
Voltage
at which the growth of deformation proportional to the load is violated, is called the limit of proportionality. At load P
<
Рn
unloading the sample leads to the disappearance of the deformation that arose in it under the influence of the applied force;
such deformation is called elastic. A slight excess of the load relative to Pn
may not change the nature of the deformation - it will still retain its elastic nature. The greatest load that a sample can withstand without the appearance of residual plastic deformation during unloading determines the elastic limit of the material:
In non-metallic structural materials (plastic, rubber), the applied load can cause elastic, highly elastic and residual deformation. Unlike elastic, highly elastic deformation does not disappear immediately after unloading, but over time. High-strength reinforced polymers (fiberglass, carbon fiber, etc.) are destroyed at an elongation of 1-3%. At the last stages of loading, some reinforced polymers exhibit highly elastic deformation. The highly elastic modulus is lower than the elastic modulus, so the deformation diagram in this case tends to deviate towards the x-axis.
Elastic properties.
In the elastic region, stress and strain are related by a proportionality coefficient.
When stretched, s = Ed, where E
is the so-called.
normal elastic modulus, numerically equal to the tangent of the angle of inclination of the straight section of the curve s = s(d) to the deformation axis ( Fig. 2
). When testing a cylindrical or flat sample for tension, a uniaxial (s1>0; (s2 = s3 = 0) stress state corresponds to a triaxial deformed state (an increase in length in the direction of the applied forces and a decrease in linear dimensions in two other mutually perpendicular directions): d1>0 ; d2 = d3 < 0. Relationship between transverse and longitudinal strain (Poisson's ratio)
within the elasticity range for basic structural materials it fluctuates within rather narrow limits (0.27–0.3 for steels, 0.3–0.33 for aluminum alloys). Poisson's ratio is one of the main calculation characteristics. Knowing m and E
, it is possible to determine the shear modulus by calculation
and bulk modulus
To determine E, G
, and m use
strain gauges
.
Resistance to plastic deformation.
At loads
P
>
Pb
, along with ever-increasing elastic deformation, noticeable irreversible plastic deformation appears, which does not disappear upon unloading. The stress at which the residual relative deformation (tensile elongation) reaches a given value (according to GOST - 0.2%) is called the conditional yield strength and is designated
In practice, the accuracy of modern testing methods is such that sp and se are determined with specified tolerances, respectively, for deviation from the law of proportionality [an increase in ctg(90 - a) by 25-50%] and for the amount of residual deformation (0.003-0.05%) and say about the conditional limits of proportionality and elasticity. The tensile curve of structural metals may have a maximum (point c in Fig. 2
) or break off when the maximum load
Рв
' is reached. Attitude
characterizes the temporary resistance (tensile strength) of the material. If there is a maximum on the tensile curve in the area of loads lying on the curve to the left in
, the sample is deformed uniformly along the entire calculated length
l
0, gradually decreasing in diameter, but maintaining the initial cylindrical or prismatic shape.
During plastic deformation, metals are strengthened, therefore, despite the reduction in the cross-section of the sample, further deformation requires the application of an ever-increasing load. sв, like the conventional s0.2, sn and se, characterizes the resistance of metals to plastic deformation. In the section of the deformation diagram to the right, the shape of the tensile sample changes: a period of concentrated deformation begins, expressed in the appearance of a “neck”. The reduction in the cross-section in the neck “overtakes” the strengthening of the metals, which causes a drop in the external load in the section Pb - Pk
.
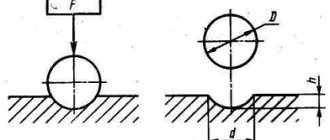
For many structural materials, the resistance to plastic deformation in the elastic-plastic region during tension and compression is almost the same. Some metals and alloys (for example, magnesium alloys, high-strength steels) are characterized by noticeable differences in this characteristic under tension and compression. Resistance to plastic deformation is especially often (when monitoring product quality, standard heat treatment conditions, and in other cases) assessed based on the results of hardness tests by pressing a hard tip in the shape of a ball (Brinell or Rockwell hardness), cone (Rockwell hardness) or pyramid (Vickers hardness). Hardness tests do not require violating the integrity of the part and therefore are the most widespread means of monitoring mechanical properties. Brinell hardness (HB) when indenting a ball with diameter D
under load
P
characterizes the average compressive stress, conventionally calculated per unit surface of a spherical imprint with diameter
d
:
Plasticity characteristics.
Tensile plasticity of structural materials is assessed by elongation
or narrowing
when compressed - shortening
(where h0
and
hk
- the initial and final height of the sample), in case of torsion - the maximum angle of twist of the working part of the sample Q,
rad
or relative shift g = Q
r
(where
r
is the radius of the sample).
The final ordinate of the deformation diagram (point k
in
Fig. 2
) characterizes the fracture resistance of the metal
Sk
, which is determined
(Fk
- actual area at the rupture site).
Characteristics of destruction.
Destruction does not occur instantly (at point
k
), but develops over time, and the beginning of destruction may correspond to some intermediate point in the section
vk
, and the whole process ends when the load gradually drops to zero.
The position of point k on the deformation diagram is largely determined by the rigidity of the testing machine and the inertia of the measuring system. This makes the value of Sk
largely arbitrary.
Many structural metals (steels, including high-strength, heat-resistant chromium-nickel alloys, soft aluminum alloys, etc.) fail in tension after significant plastic deformation with the formation of a neck. Often (for example, in high-strength aluminum alloys) the fracture surface is located at an angle of approximately 45° to the direction of the tensile force. Under certain conditions (for example, when testing cold-brittle steels in liquid nitrogen or hydrogen, when exposed to tensile stresses and a corrosive environment for metals prone to stress corrosion), fracture occurs along sections perpendicular to the tensile force (direct fracture), without macroplastic deformation.
The strength of materials realized in structural elements depends not only on the mechanical properties of the metal itself, but also on the shape and size of the part (the so-called shape and scale effects), the elastic energy accumulated in the loaded structure, the nature of the acting load (static, dynamic , periodically changing in magnitude), schemes for the application of external forces (uniaxial, biaxial stretching, with superimposed bending, etc.), operating temperature, environment. The dependence of the strength and ductility of metals on the shape is characterized by the so-called. sensitivity to notch, usually assessed by the ratio of the tensile strengths of notched and smooth samples
(for cylindrical samples, the cut is usually made in the form of a circular recess, for strips - in the form of a central hole or side cuts). For many structural materials, this ratio under static load is greater than unity, which is associated with significant local plastic deformation at the apex of the notch. The sharper the cut, the smaller the local plastic deformation and the greater the proportion of direct fracture in the failed section. A well-developed direct fracture can be obtained at room temperature in most structural materials in laboratory conditions, if samples with a massive cross-section (thicker, the more plastic the material is) are subjected to stretching or bending, providing these samples with a special narrow slot with an artificially created crack ( Fig. 3
).
When a wide, flat sample is stretched, plastic deformation is difficult and is limited to a small area of size 2 ry
(shaded in
Fig. 3b
) immediately adjacent to the crack tip. Direct fracture is usually characteristic of operational failures of structural elements.
K1C , proposed by the American scientist J.R. Irwin as constants for conditions of brittle fracture, have become widespread.
and fracture toughness
In this case, the destruction process is considered in time and K1C
(
G1C
) refer to the critical moment when the stable development of the crack is disrupted; a crack becomes unstable and propagates spontaneously when the energy required to increase its length is less than the energy of elastic deformation arriving at the crack tip from adjacent elastically stressed zones of the metal.
When assigning sample thickness t
and crack sizes 2
ltr
are based on the following requirement
Stress intensity factor K
takes into account not only the load value, but also the length of the moving crack:
(l takes into account the geometry of the crack and the sample), expressed in kgf/mm3/2
or
Mn/m3/2.
By
K1C
or
G1C
one can judge the susceptibility of structural materials to brittle fracture under operating conditions.
To assess the quality of metal, bending impact tests on prismatic samples with a notch on one side are very common. In this case, impact strength
(in
kgf
×
m/cm2
or
MJ/m2
)
-
the work of deformation and destruction of the sample, conditionally related to the cross section at the notch location.
Impact bending tests on samples with an artificially created fatigue crack at the base of the notch have become widespread. atom
samples is generally in satisfactory agreement with such a fracture characteristic as
K1C
, and even better with the ratio
Time dependence of strength.
As the load duration increases, the resistance to plastic deformation and fracture resistance decrease.
At room temperature in metals, this becomes especially noticeable when exposed to a corrosive (stress corrosion) or other active (Rehbinder effect) environment. At high temperatures, the phenomenon of creep
, i.e., an increase in plastic deformation over time at constant stress (
Fig. 4
, a).
The creep resistance of metals is assessed by the conditional creep limit - most often the stress at which plastic deformation reaches 0.2% in 100 hours
, and is designated s0.2/100.
The higher the temperature t
, the more pronounced the phenomenon of creep and the more the resistance to destruction of the metal decreases over time (
Fig. 4
, b)
.
The last property is characterized by the so-called. limit of long-term strength, i.e. stress, which at a given temperature causes destruction of the material in a given time (for example, st100, st1000, etc.). In polymeric materials, the temperature-time dependence of strength and deformation is more pronounced than in metals. When plastics are heated, highly elastic, reversible deformation is observed; starting from a certain higher temperature, irreversible deformation develops associated with the transition of the material to a viscous-flow state. Another important mechanical property of materials is associated with creep—the tendency to stress relaxation, i.e., to a gradual drop in stress under conditions when the general (elastic and plastic) deformation maintains a constant specified value (for example, in tightened bolts). Stress relaxation is caused by an increase in the proportion of the plastic component of the total deformation and a decrease in its elastic part.
If the metal is subject to a load that periodically changes according to some law (for example, sinusoidal), then with an increase in the number of cycles N
load, its strength decreases (
Fig. 4
, c) - the metal “gets tired”.
For structural steel, such a drop in strength is observed up to N
= (2-5) × 106 cycles. In accordance with this, they talk about the fatigue limit of structural steel, usually meaning the stress amplitude
below which steel does not fail under repeated varying loads. At |smin| = |smax| The fatigue limit is designated by the symbol s-1. The fatigue curves of aluminum, titanium and magnesium alloys usually do not have a horizontal section, so the fatigue resistance of these alloys is characterized by the so-called. limited (corresponding to a given N
) limits of fatigue. Fatigue resistance also depends on the frequency of load application. The resistance of materials under conditions of low frequency and high levels of repeated loading (slow, or low-cycle, fatigue) is not clearly related to fatigue limits. In contrast to a static load, under repeated variable loads sensitivity to a notch always appears, i.e., the fatigue limit in the presence of a notch is lower than the fatigue limit of a smooth sample. For convenience, sensitivity to notch during fatigue is expressed by the ratio
characterizes the asymmetry of the cycle). In the fatigue process, one can distinguish a period preceding the formation of a source of fatigue failure, and following it, sometimes quite long, the period of development of a fatigue crack. The slower the crack develops, the more reliable the material in the structure works. Fatigue crack propagation rate dl/dN
is associated with the stress intensity factor by a power function:
A distinction is made between thermal fatigue resistance when the stresses that appear in the material are due to the fact that, for one reason or another, for example, due to the shape of the part or the conditions of its fastening, thermal movements occurring during cyclic temperature changes cannot be realized. Thermal fatigue resistance also depends on many other properties of the material - coefficients of linear expansion and thermal diffusivity, elastic modulus, elastic limit, etc.
Lit.:
Davidenkov N.N., Dynamic testing of metals, 2nd ed., L. - M., 1936; Ratner S.I., Failure under repeated loads, M., 1959; Serensen S.V., Kogaev V.P., Shneiderovich R.M., Load-bearing capacity and strength calculations of machine parts, 2nd ed., M., 1963; Applied issues of fracture toughness, trans. from English, M., 1968; Fridman Ya. B., Mechanical properties of metals, 3rd ed., M., 1974; Methods of testing, control and research of engineering materials, ed. A. T. Tumanova, vol. 2, M., 1974.
S. I. Kishkina.
Contents TSB
Hardness
Methodology for testing metals for hardness
When exposed to external factors, metal products undergo deformation - plastic or elastic. Hardness describes the resistance to these factors, characterizes the degree to which the original shape and properties of the material or product are preserved.
Depending on the desired results, testing the material for hardness is carried out using three methods:
- static. Mechanical force is applied to a special indicator located on the surface of the metal. This is done gradually and at the same time the degree of deformation is recorded;
- dynamic. The impact occurs to fix elastic recoil or form an imprint with a certain configuration;
- kinetic. Similar to static. The difference lies in the continuous exposure to plot the changes in the characteristics of the sample.
Hardness measurement depends on the chosen method - Brinell (HB), Rockwell (scales A, B and C) or Vickers (HV). It all depends on the degree of impact on the material, with which you can determine the surface, projection or volumetric hardness.
The Moss scale is rarely used to calculate the hardness index. Its essence is to calculate the characteristics of an object by scratching its surface.
Strength classes and their designations
Regulatory documents on the mechanical properties of fasteners introduced the concept of metal strength class and established a designation system. Each strength class is indicated by two numbers, between which a dot is placed. The first number means the tensile strength reduced by 100 times. For example, a strength class of 5.6 will mean that the tensile strength will be 500. The second number is increased by 10 times - this is the ratio of the yield strength to the tensile strength, expressed as a percentage (500x0.6 = 300), i.e. 30% is the minimum yield strength of tensile strength. All products used for fastening are classified according to their intended use, shape, material used, strength class and coating. According to their intended use, they are:
- Ploughshares. They are used for agricultural machines.
- Furniture. Used in construction and furniture production.
- Road. They fasten metal structures.
- Mechanical engineering. Used in the mechanical engineering industry and instrument making.
The mechanical properties of fasteners depend on the steel from which they are made and the quality of processing.
Viscosity and brittleness
Description of viscosity index
These characteristics indicate the metal's ability to resist impact loads. The indicator is the rate of deformation, i.e. changing the original configuration of the workpiece under external influence.
Knowledge of the viscosity and brittleness index is necessary to calculate the absorbed impact energy, which leads to deformation of the metal sample. Depending on the required data, the following measurement methods and types of metal viscosity are distinguished:
- static. There is a slow impact on the material until its destruction;
- cyclical. The sample is subjected to repeated loads with the same or varying force. In this case, the main value of cyclic viscosity is the amount of work required to destroy the sample;
- percussion. To calculate it, a pendulum pile driver is used. The workpiece is mounted on the lower base, the pendulum with the chopping cone is located at the top point. After it is lowered, interaction between the metal and the chopping part occurs. The degree of deformation is characterized by the viscosity of the sample.
Depending on the measurement system, there are different viscosity indicators:
- SI - m²/s;
- GHS – Stokes (ST) or centistokes (cSt)
In addition to the test method, it is necessary to take into account other mechanical properties of metals - temperature on its surface and in the structure, humidity in the room, etc.
Brittleness is the inverse of toughness. It determines how quickly a metal or alloy will degrade under the influence of an external force.
Determination of metal strength
One of the main requirements for metal used for the production of metal structures and parts is strength. To determine it, a metal sample is taken and stretched on a testing machine. The standard becomes thinner, the cross-sectional area decreases while its length increases. At a certain point, the sample begins to stretch in only one place, forming a “neck”. And after some time, a rupture occurs in the area of the thinnest place. Only ductile and brittle metals behave this way: hard steel and cast iron stretch only slightly and do not form a neck.
The load on the sample is determined by a special device called a force meter, which is built into the testing machine. To calculate the main characteristic of a metal, called the tensile strength of the material, it is necessary to divide the maximum load the sample can withstand before breaking by the cross-sectional area before tension. This value is necessary for the designer to determine the dimensions of the part to be manufactured, and for the technologist to assign processing modes.
Voltage
Types of stress
Stress is the occurrence of internal forces with different directional vectors under external influence. This value can be internal or superficial. It is mandatory for calculations in the manufacture of load-bearing steel structures or equipment elements subject to constant loads.
The main condition for measuring this indicator is a uniform load acting in a certain direction. In this case, a stressed state arises in the sample, which is exposed to balanced forces. In addition, the impact can be single-sector or multi-vector.
There are the following types of stress of materials and their alloys:
- residual. It is formed after the end of exposure to external factors. These include not only mechanical forces, but also rapid heating or cooling of the sample;
- temporary. Occurs only under external loads. After their termination, the product acquires its original characteristics;
- internal. Most often it occurs as a result of uneven heating of workpieces.
Stress is the ratio of a force to the area over which it is applied.
In addition to direct pressure on the surface, tangential pressure can be observed. Calculation of this parameter requires more complex techniques.
Specific strength
The specific strength of a material (formula below) is characterized by the ratio of the tensile strength to the density of the metal. This value shows the strength of the structure for a given mass. It is of greatest importance for such industries as aircraft manufacturing, rocketry and spacecraft production.
In terms of specific strength, titanium alloys are the strongest of all technical materials used. Titanium alloys have twice the specific strength of metals classified as alloy steels. They are not susceptible to corrosion in air, in acidic and alkaline environments, are not afraid of sea water and have good heat resistance. At high temperatures, their strength is higher than that of alloys with magnesium and aluminum. Due to these properties, their use as a structural material is constantly increasing and is widely used in mechanical engineering. The disadvantage of titanium alloys is their low machinability. This is due to the physical and chemical properties of the material and the special structure of the alloys.
Above is a table of the specific strength of metals.
Endurance and fatigue
Example of deformation due to metal fatigue
With prolonged application of external forces, deformations and defects are revealed in the structure of the sample. They lead to a loss of strength of the sample and, as a consequence, to its destruction. This is called metal fatigue. Endurance is the opposite characteristic.
This phenomenon occurs as a result of the appearance of successive stresses (internal or surface) over a certain period of time. If the structure does not undergo changes, they speak of a good indicator of endurance. Otherwise, deformation occurs.
Depending on the accuracy of the calculation, the following endurance tests are performed on the sample in order to find out the mechanical properties of metals:
- clean bend. The part is fixed at the ends and rotates, as a result of which it is deformed;
- transverse bending Additionally, the sample is rotated;
- bending in one plane;
- transverse and longitudinal bending in one plane;
- uneven torsion with cycle repetition.
These tests allow you to determine the endurance index and calculate the time of onset of fatigue of the part.
To carry out tests, it is necessary to be guided by accepted methods, which are set out in GOST-1497-84. Particular attention is paid to deviations of metal properties from the norm.
Using the plasticity and strength of metals
Very important properties of metal are ductility and strength. These properties are directly dependent on each other. They do not allow the metal to change shape and prevent macroscopic destruction when exposed to external and internal forces.
Metals with high ductility are destroyed gradually under load. At first they have a bend and only then does it begin to gradually collapse. Ductile metals easily change shape, which is why they are widely used to make car bodies. The strength and ductility of metals depends on the direction of the forces applied to it and in which direction the rolling was carried out during the manufacture of the material. It has been established that when rolling, metal crystals elongate in its direction more than in the transverse direction. Sheet steel has much greater strength and ductility in the rolling direction. In the transverse direction, strength decreases by 30%, and ductility by 50%; along the thickness of the sheet, these figures are even lower. For example, the appearance of a fracture on a steel sheet during welding can be explained by the parallelism of the weld axis and the rolling direction. Based on the ductility and strength of a material, the possibility of its use for the manufacture of various parts of machines, structures, tools, and devices is established.