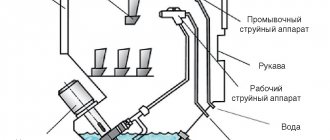
What is plane roughness by type of processing
When manufacturing the required part, in accordance with technical drawings and sketches, various types of processing are used. The initial workpiece is subjected to heating, drilling, cutting and other technological operations.
Each type of processing of a product leaves a certain pattern on its surface in the form of small shagreen, gouges, microscopic cracks and scratches. All these consequences are displayed in the form of roughness on the processed surface of the product.
According to the type of technological impact, a certain class of plane roughness arises. All types and dimensions of this phenomenon are presented in more detail in GOST 2789-73 “ Surface Roughness ” .
The standard contains detailed information with illustrations of roughness. Some types of technical influence leave changes on the surface of the material that are not noticeable to the eye. These roughnesses are studied under a microscope.
The main indicators of shagreen include:
- The height of the treated surface, measured in 10 points;
- Average number of plane deviations;
- Average pitch of irregularities;
- The highest point of the plane after processing;
- Profile reference length.
Finishing metal grinding and polishing of the product maximally levels the surface of the processing, but internal changes at the molecular level in the material leave certain consequences in the form of microscopic shagreen.
7.7. Surface treatment
Designation of surface roughness (see table 7.3, table 7.4):
| – sign I is used for a surface the type of processing of which is not specified by the designer; | |
| – mark II is applied to a surface that must be processed by removing a layer of material, for example, turning, milling, drilling, grinding, polishing, etching, etc.; | |
| – sign III is used for a surface formed without removing a layer of material, for example, by casting, volumetric forging, stamping, rolling, drawing, etc. |
Table 7.3. Recommended roughness of mating surfaces of parts. Female and male cylindrical and prismatic surfaces
| Qualities | Surface | |||||||
| 6; 7 | 8; 9 | 11 | 12 | cylindrical | flat | |||
| hole | shaft | |||||||
| Working conditions | ||||||||
| friction, wear | frictionless | friction, wear | frictionless | |||||
| Nominal size, D and B. mm | Recommended roughness | |||||||
| 10-30 | – | – | – | 1,25 | 2,5 | 0,63 | 1,25 | 2,5 |
| 30-120 | <6 | – | – | |||||
| 120-180 | 6-18 | – | – | 1,25 | ||||
| > 180 | 18-80 | <3 | – | 2,5 | 2,5 | |||
| – | 80-360 | 3-10 | – | 2,5 | ||||
| – | >360 | 10-30 | <6 | Rz20 | Rz20 | Rz20 | ||
| – | – | 30-120 | 6-15 | Rz20 | Rz20 | |||
| – | – | >120 | 15-80 | Rz40 | Rz40 | |||
| – | – | – | 80-260 | Rz40 | Rz40 | Rz40 | ||
| – | – | – | >260 | Rz80 | Rz80 | |||
Table 7.4. Optimal surface roughness of parts for different processing methods
| Type of processing | Surface roughness | |||
| Forging | Rz630 | |||
| Forging when heating the forging with gaseous fuel | Rz1000 | |||
| Sand casting | steel castings | Rz1250 | ||
| iron castings | Rz630 | |||
| castings from non-ferrous metals and their alloys | Rz320 | |||
| Lost wax casting | Rz80-Rz20 | |||
| Cold stamping, cutting, punching | metal thickness, mm | <=6 | Rz160 | |
| 6-10 | Rz320 | |||
| >10 | Rz400 | |||
| Mechanical cutting | rolled thickness, mm | <20 | Rz320 | |
| >20 | Rz500 | |||
| Oxygen cutting | manual | thickness of cut metal, mm | <25 | Rz1000 |
| 25-50 | Rz1600 | |||
| <25 and >50 | not regulated and not indicated on the drawings | |||
| mechanized | 5-15 | Rz160 | ||
| 15-30 | Rz320 | |||
| 30-50 | Rz630 | |||
| <5 and >50 | not regulated and not indicated on the drawings | |||
| Metalworking | Rz40-2.5 | |||
| Cleaning with emery cloth | 2,5-0,63 | |||
| External and end turning | preliminary | Rz320-Rz80 | ||
| finishing | Rz80-2.5 | |||
| thin | 1,25-0,63 | |||
| Planing | preliminary | Rz160-Rz80 | ||
| finishing | Rz40-Rz20 | |||
| thin | 2,5-1,25 | |||
| Honing | finishing | 0,63-0,32 | ||
| thin | 0,16-0,04 | |||
| Super finishing | finishing | 0,32-0,16 | ||
| thin | 0,16-0,04 | |||
| Lapping | finishing | 2,5-0,32 | ||
| thin | 1,25-0,08 | |||
| finishing | 0,08-0,04 | |||
| mirror | Rz0.1-Rz0.05 | |||
| Finishing | mechanical finishing | 0,32-0,16 | ||
| manual | preliminary | 1,25-0,63 | ||
| average | 0,63-0,32 | |||
| finishing | 0,16-0,08 | |||
| finishing | 0.04-Rz0.1 | |||
| mirror | Rz0.1-Rz0.05 | |||
| Surface rolling using roller rolling | 0,63-0,16 | |||
| Roller and ball surface rolling | 0,63-0,16 | |||
| Processing of plastics | pressing, injection molding | 1,25-0,16 | ||
| turning and milling | Rz40-Rz20 | |||
| drilling | Rz80-Rz20 | |||
| polishing | 2,5-1,25 | |||
If the roughness of the surfaces forming the contour must be the same, the roughness designation is applied once. The diameter of the auxiliary sign O is 4-5 mm. In the designation of the same roughness of surfaces that smoothly transform into one another, the sign O is not given. The designation of the same surface roughness of a complex configuration may be given in the technical requirements of the drawing with reference to the letter designation of the surface.
It is allowed to apply a roughness designation on an invisible contour line only in cases where a dimension is applied from this line.
When specifying the same roughness for all surfaces of the product, the roughness designation is placed in the upper right corner of the drawing and is not applied to the image. When indicating the same roughness for part of the surfaces of the product, a designation of the same roughness and a symbol (sign I) are placed in the upper right corner of the drawing. When some of the surfaces are not processed according to this drawing, sign III is placed in the upper right corner of the drawing before the designation (sign I). The value of the roughness parameter according to GOST 2789-73 is indicated in the roughness designation: for the Ra parameter - without a symbol; for parameter Rz - with a symbol (Figure 7.3).
Figure 7.3 - Designation of roughness in the drawing
| < 7.6. Heat Treatment Basics | Content | Literature > |
0 0 votes
Article rating
Roughness during turning
This indicator is displayed as a set of small steps of the base length of the processed plane and its irregularities. Modern turning equipment ensures the highest possible quality of parts production. Shagreen during turning is a value that is calculated at the design stage of the future product.
In many machines, by default, the required tolerances of shagreen on the plane are set, which greatly facilitates the task of personnel and increases production volumes. The main factor here is the exact shagreen indicators for the specific material from which the future part is composed.
How is plane roughness measured by type of processing?
Even the most modern technologies for working with shagreen surfaces cannot provide a perfectly smooth surface. In this regard, there are always certain deviations from the specified design drawing of the part. They can be macro or microgeometric in nature.
It is customary to distinguish 3 main types of this indicator:
- Initial shagreen (occurs when the product comes into contact with various abrasive attachments);
- Operational (manifests itself as a result of friction and natural wear during processing);
- Equilibrium (the result of friction under stationary processing conditions).
Shagreen is measured comprehensively or element by element. The second option is the most accurate, but also much more labor-intensive. In practice, the following 3 main measurement methods are used:
- Using a probe. The top layer is measured with a specialized profilometer sensor equipped with a small diamond needle. At its end there is a sensitive head, which provides signals to the device when monitoring the plane. The operation of the device resembles an echo sounder.
Profilometers are: electronic, inductive and piezoelectric. More advanced devices called profilographs are capable of recording all the measurements obtained for further study by specialist technologists.
- Optical method. It is a non-contact measuring option for shagreen, consisting of several calculation options.
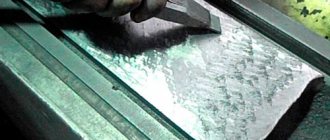
Using a raster. A thin glass plate coated with a special raster (reminiscent of a grid) is fixed onto the processed plane. Next, light rays are applied at a certain angle and the raster lines coincide with the shagreen surface, repeating its relief.
With the help of shadow. A specialized ruler with a beveled edge is placed on the element being studied. It is through it that the supplied light beam passes. The shadow that appears in this case thoroughly displays the relief of the plane of the part, the results of which are subsequently studied under a microscope.
- Microinterference method. The plane is measured using curved stripes produced by an interferometer device. And its results are subsequently studied under a microscope and an accurate picture of the surface is obtained.
The roughness of the top layer affects the further use of the resulting parts. The quality of welding of such elements, painting and other further operations depends on its coefficient.
Roughness table
The initial roughness is a consequence of the technological processing of the surface of the material. For a wide class of surfaces, the horizontal pitch of irregularities ranges from 1 to 1000 µm, and the height - from 0.01 to 10 µm. As a result of friction and wear, the parameters of the initial roughness, as a rule, change, and operational roughness is formed. The operational roughness, reproduced under stationary friction conditions, is called equilibrium roughness.
| Class | 1 | 2 | 3 | 4 | 5 | 6 | 7 | 8 | 9 | 10 | 11 | 12 | 13 | 14 |
| The cells above indicate roughness classes for comparison with the new standard | ||||||||||||||
| Ra | 100 | 50 | 25 | 12.5 | 6.3 | 3.2 | 1.6 | 0.8 | 0.4 | 0.2 | 0.1 | 0.08 | 0.025 | 0.01 |
| Rz | 400 | 200 | 100 | 50 | 25 | 12.5 | 6.3 | 3.2 | 1.6 | 0.8 | 0.4 | 0.2 | 0.1 | 0.05 |
| Sandblasting | Rz400 | |||||||||||||
| Forging in dies | Rz400 | Rz200 | Rz100 | |||||||||||
| Sawing | Rz400 | |||||||||||||
| Drilling | Rz100 | Rz50 | Rz25 | |||||||||||
| Rough countersinking | Rz100 | Rz50 | Rz25 | |||||||||||
| Finish countersinking | Rz50 | Rz25 | 3.2 | 1.6 | ||||||||||
| Deployment is normal | 3.2 | 1.6 | 0.8 | |||||||||||
| Deployment is precise | 1.6 | 0.8 | 0.4 | |||||||||||
| Deployment is subtle | 0.8 | 0.4 | 0.2 | |||||||||||
| Reaching out | Rz25 | 3.2 | 1.6 | 0.8 | 0.4 | |||||||||
| Rough turning | Rz400 | Rz200 | Rz100 | Rz50 | ||||||||||
| Finish turning | Rz100 | Rz50 | Rz25 | 3.2 | 1.6 | 0.8 | ||||||||
| Fine turning | 3.2 | 1.6 | 0.8 | 0.4 | ||||||||||
| Preliminary planing | Rz400 | Rz200 | Rz100 | Rz50 | ||||||||||
| Finish planing | Rz100 | Rz50 | Rz25 | 3.2 | 1.6 | |||||||||
| Fine planing | 1.6 | 0.8 | ||||||||||||
| Pre-milling | Rz200 | Rz100 | Rz50 | Rz25 | ||||||||||
| Finish milling | Rz25 | 3.2 | 1.6 | |||||||||||
| Milling fine | 3.2 | 1.6 | 0.8 | |||||||||||
| Pre-grinding | Rz25 | 3.2 | 1.6 | |||||||||||
| Finish grinding | 1.6 | 0.8 | 0.4 | |||||||||||
| Sanding fine | 0.4 | 0.2 | ||||||||||||
| Sanding - finishing | 0.1 | 0.08 | Rz0.1 | Rz0.05 | ||||||||||
| Rough grinding | 0.8 | 0.4 | ||||||||||||
| Lapping average | 0.4 | 0.2 | 0.1 | |||||||||||
| Fine lapping | 0.1 | 0.08 | Rz0.1 | Rz0.05 | ||||||||||
| Honing is normal | 1.6 | 0.8 | 0.4 | 0.2 | ||||||||||
| Mirror honing | 0.4 | 0.2 | 0.1 | 0.08 | ||||||||||
| Scraping | 3.2 | 1.6 | 0.8 | |||||||||||
| Rolling | Rz50 | Rz25 | 3.2 | 1.6 | 0.8 | |||||||||
| Chill casting | Rz400 | Rz200 | Rz100 | Rz50 | ||||||||||
| Injection molding | Rz400 | Rz200 | Rz100 | Rz50 | Rz25 | 3.2 | ||||||||
| Precision casting | Rz50 | Rz25 | 3.2 | 1.6 | ||||||||||
| Plastic molding, precision | Rz25 | 3.2 | 1.6 | 0.8 | 0.4 | 0.2 | 0.1 |
Surface roughness when processed with tools
Surface roughness classes
Factors affecting surface quality
Surface roughness depends on the processing method and mode, the quality of the cutting tool used, the rigidity of the technological system, the physical and mechanical properties of the material being processed, the type of coolant used, vibrations of the technological system, etc.
Each processing method (turning, grinding, etc.) has its own range of surface roughness. In table Table 3.1 shows the surface roughness for various methods of processing steel and gray cast iron and compares the roughness parameters with the parameters of average economic accuracy. From a comparison of these parameters, one can see their relationship: the higher the accuracy of the resulting size, the lower the surface roughness.
Further, on page 7, see table. 3.1.
Roughness table
| № | Surface roughness classes | Roughness parameters, microns | Base length, l, mm | |
| Ra | Rz | |||
| 1. | 2. | 3. | 4. | 5. |
| 1. | 1 | 80, 63, 40, 50* | 320, 250, 200, 160 | 8,0 |
| 2. | 2 | 40, 32, 20, 25* | 160, 125, 100, 80 | |
| 3. | 3 | 20, 16, 10, 12,5* | 80, 63, 50, 40 | |
| 4. | 4 | 10, 8, 5, 6,3* | 40, 32, 25, 20 | 2,5 |
| 5. | 5 | 5, 4, 2,5; 3,2* | 20, 16, 12,5; 10,0 | |
| 6. | 6 | 2,5; 2,0; 1,25; 1,6* | 10,0 8,0; 6,3 | 0,8 |
| 7. | 7 | 1,25; 1,00; 0,63; 0,80* | 6,3; 5,0; 4; 3,2 | |
| 8. | 8 | 0,63; 0,50; 0,32; 0,40* | 3,2; 5,2; 2,0; 1,6 | |
| 9. | 9 | 0,32; 0,25; 0,160; 0,20* | 1,6; 1,25; 1,00; 0,80 | 0,25 |
| 10. | 10 | 0,160; 0,125; 0,080; 0,10* | 0,80; 0,63; 0,50; 0,40 | |
| 11. | 11 | 0,080; 0,063; 0,040 | 0,40; 0,32; 0,25; 0,20 | |
| 12. | 12 | 0,040; 0,032; 0,020 | 0,20; 0,16; 0,125; 0,100 | |
| 13. | 13 | 0,020; 0,016; 0,010 | 0,100; 0,080; 0,063; 0,050 | 0,08 |
| 14. | 14 | 0,010; 0,008; 0,012* | 0,050; 0,040; 0,032 |
Note: * - preferred values of Ra parameters
Examples:
Designations of surface roughness in drawings
Table 3.1
| Processing method | The corresponding qualification is exact. | Surface roughness Ra, microns | Processing method | The corresponding qualification is exact. | Surface roughness Ra, microns |
| Turning: preliminary…………….. finishing…………………fine, diamond……………. Milling: preliminary……………. finishing………………………thin (with end mills).. Drilling: Countersinking: preliminary………………. finishing (after roughing)… Broaching holes…… | 12 — 13 10 — 11 6 – 7 11 — 12 8 – 10 6 – 7 11 — 12 7 – 8 | 12,5 2,5 – 1,25 0,63-0,32 12,5 2,5-1,25 0,63-0,32 6,3-2,5 2,5-12,5 6,3-2,5 1,25-0,63 | Stitching (for short holes) ………………….. Grinding: rough*…………. preliminary……. finishing ……………… thin ………………… Honing of holes with a diameter of up to 80 mm …………. Reaming: preliminary…………….. finishing……………………… thin……… Lapping in (finishing)…………. Polishing **………………… | — 8-10 7-8 6-7 6-7 8-9 6-7 5-6 — | 0.63-0.32 2.5-1.25 1.25-0.63 0.63-0.32 0.32-0.08 0.32-0.08 2.5-1.25 1 .25-0.63 0.63-0.32 0.1 and less 0.032-0.012 |
* Rough grinding is used as a preliminary treatment of the surfaces of castings and forgings, without maintaining dimensional tolerances.
** This method does not improve the accuracy of the size obtained in previous processing.
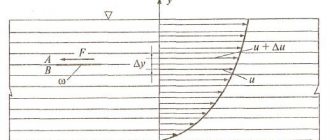
When processing workpieces with blade tools, the surface roughness largely depends on the cutting speed and feed. In Fig. 3.5, a shows the effect of cutting speed on surface roughness when turning steel (curve 1) and cast iron (curve 2). After turning a steel workpiece at a cutting speed of about 20 m/min (curve 1), the greatest roughness is observed, which is associated with the phenomenon of active formation of built-up edge on the cutting part of the cutter. At cutting speeds above 80 m/min, the formation of built-up edge practically stops. In addition, at high cutting speeds, the depth of the plastically deformed layer is significantly reduced, which also reduces the surface roughness.
In Fig. Figure 3.5, b shows the dependence of surface roughness on feed when turning a workpiece made of steel 45 with a cutter with a tip radius of 2.5 mm. The figure shows that changes in small feeds (up to 0.2 mm/rev) have little effect on the change in surface roughness. But when moving to the feed range above 0.2 mm/rev, the microroughness of the machined surface increases more intensively.
Rice. 3.5. Graphs of surface roughness versus cutting speeds and feeds
With increasing cutting depth, surface roughness increases slightly and practically can be ignored.
The condition of the cutting part of the tool has a significant influence on the surface roughness: micro-roughness of the cutting edge of the tool worsens the roughness of the machined surface; this is especially noticeable when processing with broaches, reamers or wide cutters. Dulling of the cutting tool leads to an increase in the roughness of the machined surface.
When processing workpieces with an abrasive tool, the surface roughness decreases with a decrease in grain size and an increase in the hardness of the grinding wheel, an increase in cutting speed, and a decrease in longitudinal and transverse feeds.
When machining steel with a high carbon content (C > 0 5%), a cleaner surface is obtained than when machining low-carbon steel.
The use of a cutting fluid improves the roughness of the machined surface. At the same time, tool life increases. In Fig. Figure 3.6 shows (according to K. S. Kolev) the effect of cooling on the microgeometry of the surface when turning X4N steel with a high-speed cutter at a feed S = 0.67 mm/rev: 1 - turning without the use of cooling; 2 - cooling with a water emulsion (0.5% soda and 0.1% soap).
The rigidity of the process system significantly influences the surface roughness and waviness. So, for example, when turning a non-rigid shaft with installation on centers, the greatest surface roughness is obtained approximately in the middle part along the length of the shaft. Insufficient rigidity of the system can cause vibration during cutting and, as a result, the formation of a wavy surface.
Rice. 3.6. Rice. 3.7.
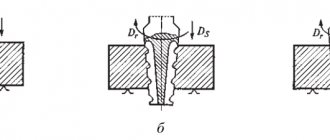
The physical and mechanical properties of the surface layer of parts and workpieces largely depend on the influence of thermal and force factors during processing. The surface layer of the processed steel workpiece consists of three zones (Fig. 3.7): I – zone of pronounced deformation, characterized by distortion of the crystal lattice, grain fragmentation and increased hardness; II – deformation zone, characterized by elongated grains and a decrease in hardness compared to the first zone; III - transition zone (zone of gradual transition to the structure of the base metal).
Initial steel blanks obtained by forging, casting or rolling have a surface layer consisting of a decarburized zone and a transition zone, i.e., a zone with partial decarburization. For example, workpieces produced by hot stamping have a decarburized layer in the range of 150-300 microns, and those obtained by free forging - from 500 to 1000 microns.
When processing steel workpieces by cutting, the depth of deformation extends to 100-300 microns. For cast iron workpieces, the depth of deformation is insignificant (up to 15 microns).
During mechanical processing of metals, deformation of the surface layer is accompanied by hardening (hardening) of this layer. With increasing cutting depth and feed, the depth of the hardened layer increases. So, for example, during rough turning the work hardening depth is 200-500 µm, during finishing turning 25-30 µm, during grinding 15-20 µm and during very fine processing 1-2 µm.
Rice. 3.8. Rice. 3.9.
With increasing cutting speed, the depth of work hardening decreases. This is explained by a decrease in the duration of the action of cutting forces on the deformed metal. In Fig. Figure 3.8 shows (according to K.S. Kolev) the influence of cutting speed v during turning of steel ZOKHGS (curve 1) and steel 20 (curve 2) on hardening Hd.
When grinding parts, the dominant factor is thermal, which causes tensile stresses to appear in the surface layer of the metal being processed. In Fig. Figure 3.9 shows a diagram of the distribution of residual stresses σ after grinding to a depth h of the surface layer (curve 1). The appearance of tensile stresses is associated with rapid heating of the surface layer in the area of contact between the metal of the part and the grinding wheel. After passing the grinding wheel, the surface layer, cooling, tends to shrink, causing tensile stresses. When grinding with curing (i.e., with subsequent switching off of the longitudinal feed), tensile stresses significantly decrease and compressive stresses increase (curve 2).