Low carbon steels on the phase diagram
The iron-carbon phase diagram shows the dependence of the phase composition of steel on temperature: austenite, ferrite, or a mixture of both. In pure iron, austenite turns into ferrite when cooled to 912 ºC. The temperature at which austenite begins to transform into ferrite is traditionally called the A3 temperature.
Eutectoid point of steels
Adding carbon to iron causes the A3 temperature to decrease. The maximum reduction in this temperature – 727 ºС – is achieved at a carbon content of 0.77%. This point on the iron-carbon phase diagram is called the eutectoid point or sometimes the pearlite point. At this point in the phase diagram, a eutectoid reaction occurs, that is, a reaction in which one solid phase turns into two solid phases. Steels that have a carbon content of less than 0.77% are called hypoeutectoid steels or low-carbon steels. The eutectoid temperature of 727 ºС is traditionally designated A1.
Solubility of carbon in ferrite and austenite
Steels that are 100% austenite occupy the central dark region of the phase diagram in Figure 1. Steels that are ferrite should have a temperature-carbon content coordinate in the narrow dark region on the left edge of the phase diagram. The maximum carbon content that can dissolve in ferritic iron is only 0.02% and this occurs at the eutectoid temperature of 727 ºC. This means that ferrite is essentially pure iron, as it is 99.98% pure to carbon and purer.
Figure 1 – Part of the iron-carbon phase diagram for hypoeutectoid – low-carbon – steels
(carbon content less than 0.77%)
Austenite can dissolve carbon much more than ferrite. At eutectoid temperature, austenite dissolves 0.77% carbon, which is 38 times more than ferrite can contain at the same temperature. Austenite contains more carbon than ferrite because the face-centered crystal structure of austenite has more space between the iron atoms than the body-centered crystal structure of ferrite.
Hypoeutectoid steels – steel 40
Consider the shaded area of the phase diagram in Figure 1, which is designated γ+α. This region represents a set of “temperature - carbon content” coordinates, at which steel is a mixture of ferrite and austenite.
Let's imagine a high-temperature microscope through which we examine the polished surface of steel with a carbon content of 0.4% - low-carbon steel 40 - at a temperature of 760 ºC. Since a point with such a chemical composition and at such a temperature lies in the region γ+α, the steel will be a mixture of ferrite and austenite. An example of such a structure is shown at the bottom of Figure 1. The phase diagram also gives information about the composition of the two phases. Austenitic grains must have a composition, which is indicated in the phase diagram of Figure 2 by the letter N, and ferrite must have a composition, which is indicated by the letter M.
Figure 2 – Part of the iron-carbon phase diagram and changes in the microstructure of low-carbon steel
when cooling steel 40 from 850 to 760 ºС
Cooling of steel 40 – ferrite along the boundaries of austenite grains
To illustrate the usefulness of a phase diagram, consider the following simple experiment. Steel with a carbon content of 0.4% - low-carbon steel 40 - is first heated to a temperature of 850 ºC and held there for about 10 minutes. After this short exposure, all grains in this steel will be pure face-centered austenitic grains with a carbon content of 0.4%.
Cementite: forms of existence
This is the name given to the compound of carbon and iron. It is a component of cast iron and some steels. It contains 6.67% carbon.
Its crystal includes several octahedra; they are located with respect to each other at a certain angle. Inside each of them is a carbon atom. As a result of this construction, the following picture is obtained - one atom comes into contact with several atoms of iron, and iron, in turn, is connected with three atoms of this element.
Crystal lattice of cementite
This substance has all the properties that are inherent in metals - electrical conductivity, a peculiar shine, high thermal conductivity. That is, a mixture of iron and carbon behaves like a metal. This material has a certain fragility. Most of its properties are determined by the complex structure of the crystal lattice.
This material melts at 1600 degrees Celsius. But there are several opinions on this matter; some researchers believe that its melting point lies in the range from 1200 to 1450, others determine that the upper level is 1300 °C.
Primary cementite
Metallurgists distinguish three types of this substance - primary, secondary, tertiary.
Iron-cementite diagram
Primary, obtained from the liquid during hardening of alloys that contain 5.5% carbon. The primary one has the shape of large plates.
Secondary
This element is obtained from austenite when the latter is cooled. On the diagram, this process can be seen in the Fe – C diagram. Cementite is presented in the form of a grid placed along the grain boundaries.
Tertiary
This type is derived from ferrite. It is shaped like needles.
There are other forms of cementite in metallurgy, for example, Stead's cementite, etc.
Other structural components in the iron-carbon system
Perlite
Perlite is a mechanical mixture that consists of ferrite and cementite. Ledeburite is a variable solution.
Perlite
At temperatures from 1130 to 723 ° C, its composition includes austenite and cementite. At lower temperatures it consists of austenite replacing ferrite.
Hypoeutectoid steels
Laboratory work No. 1
Subject:
MICROSTRUCTURAL ANALYSIS OF METALS AND ALLOYS IN EQUILIBRIUM STATE.
Goal of the work
.Familiarize yourself with the methods of microscopic analysis of iron-carbon alloys and study the microstructures of carbon steels and cast irons. This topic is important for understanding the nature of iron-carbon alloys (iron, steel, cast iron). Students must clearly understand the process of crystallization of these alloys, the nature of allotropic transformations and the associated change in the properties of the alloys.
The iron-carbon diagram should be studied in parts. First you need to take the upper iron corner, where the delta solution and gamma solution (austenite) are formed, and carefully process the process of formation of these solutions at different carbon contents at different temperatures. Then we should examine in detail the primary crystallization of alloys with a carbon content above two percent (cast iron alloys) and move on to studying the process of secondary crystallization of alloys.
Here it is necessary to understand the process of recrystallization of austenite for alloys with different carbon contents with decreasing temperature. It is necessary to have a good knowledge of the structural components of steels and cast irons (ferrite, pearlite, austenite, cementite, ledeburite, etc.) and be able to show where they are on the iron-carbon phase diagram.
In addition, you should have a good understanding of the classification of steels and cast irons by purpose and chemical composition, and the marking of alloys according to GOST depending on the carbon content, alloying elements and structure of the alloys.
Exercise.
- To study the microstructure of hypoeutectoid, eutectoid and hypereutectoid steels in the annealed state.
- To study the microstructure of white, gray, ductile and high-strength cast iron.
- Master the method of approximate determination of carbon content in steel.
- Draw a phase diagram for iron cementite.
- Draw conclusions from the work.
Devices, materials, tools
.To complete the work you must:
- metallographic microscopes MIM-7;
- sets of microsection sets;
-albums of photographs of microstructures.
Experimental procedure.
Laboratory work is carried out after studying the state diagram of iron-carbon (iron-cementite), having studied the structural components of iron-carbon alloys. The work is carried out by three teams of 4-5 people. Each workplace is equipped with one metallographic microscope and a set of sections of iron-carbon alloys.
Theory.
The sub-equilibrium state of the alloy is understood as the state when all phase transformations in the alloy are completely completed in accordance with the phase diagram. This state appears only with very slow cooling. Consequently, the basis for determining the structural components of iron-carbon alloys in an equilibrium state is the Fe–Fe3C state diagram (Fig. 3.1), the foundations of which were derived by D.K. Chernov when he discovered
Change in structure depending on carbon content
An increase in carbon content due to its low solubility in ferrite causes the appearance of a second phase - tertiary cementite. With a carbon content of up to 0.025%, structurally free cementite is precipitated mainly along the boundaries of ferrite grains. This significantly reduces the ductility and toughness of steel, especially if cementite is arranged in chains or forms a network around ferrite grains.
When the carbon content increases above 0.025%, pearlite is formed in the steel structure; at the same time, even up to 0.10 - 0.15% C, inclusions of structurally free (tertiary) cementite appear in the steel. With a further increase in carbon content, tertiary cementite is included in the composition of perlite.
Based on their microstructure, steels are divided into hypoeutectoid, eutectoid and hypereutectoid.
Hypoeutectoid steels contain more than 0.02% but less than 0.8% carbon. The structure of hypoeutectoid steels consists of ferrite and pearlite (we neglect the separation of excess tertiary cementite from ferrite). With increasing carbon content, the amount of ferrite in hypoeutectoid steels decreases, and pearlite increases (Fig. 3).
When the steel contains 0.8% carbon, the amount of pearlite is 100%.
Figure 10 shows the microstructure of hypoeutectoid steel with different carbon contents. It is clearly seen that the perlite content (dark component) increases with increasing carbon content.
The structure of eutectoid steel (0.8 C) consists of one pearlite, the entire field is filled with pearlite.
The structure of hypereutectoid steels at room temperature consists of pearlite and secondary cementite, and cementite can be located in the form of a network, grains or needles. In the structure of hypereutectoid steels, instead of ordinary pearlite, there may be granular pearlite, which is obtained after special heat treatment. It is formed in steel U9-U13 from austenite during cooling. A cementite network begins to form on the ES line, pearlite – on the PSK line. The maximum amount of structurally free cementite (~ 20%) will be in an alloy with a carbon content of 2.14%.
Rice. 4. Equilibrium diagram
Sequence of formation of the equilibrium structure
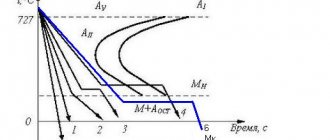
Using the example of an alloy containing 0.5% C, we will consider the sequence of phase transformations that ultimately form an equilibrium structure, assuming its cooling from the temperature of the liquid state to equilibrium. The cooling curve diagram is shown in Fig. 4.1.
So, simple cooling of the liquid alloy follows to temperature 1.
From point 1, lying on the liquidus line, the formation of austenite crystals begins. Their number increases and at the temperature at point 2 the crystallization process ends. This will be followed by simple cooling of the austenite grains.
| t, ° C |
| L |
| L+ g |
| g |
| g+α |
| α p +g S →(α+Fe3C) |
| α+(α+Fe3C) |
| Time |
| τ |
| 4׳ |
Rice. 4.1. Scheme of the cooling curve of the alloy (0.5% C) and the formation of its equilibrium ferrite-pearlite structure
Upon reaching the temperature of point 3 (Fig. 4.1), through the restructuring of the fcc lattice into the bcc lattice, austenite begins to transform into ferrite. This occurs almost simultaneously in each austenite grain. Moreover, the concentration of carbon in the resulting ferrite, in accordance with its nature, is determined by the PG curve of the phase diagram. Since in the temperature range 3-4 a ferrite component with a clearly lower content of dissolved carbon appears in austenite and increases quantitatively than in the analyzed alloy, the carbon concentration in austenite that decreases in quantity increases. Its changes are described by the GS diagram curve (Fig. 4.1).
As a result, at the temperature of point 4, within the boundaries of each primary austenite grain, ferrite of composition point P and the remainder of austenite of composition point S will be in equilibrium.
Subsequent heat removal will disrupt the stability of the austenite residue and it will undergo a diffusion eutectoid transformation into pearlite according to the following scheme:
EFg S
→ (α+Fe3C)
The process occurs with the release of thermal energy and therefore occurs on the 4-4′ segment of the isotherm (Fig. 4.1). Cooling below point 4′ will practically not change the resulting structure. It consists of ferrite and pearlite.
A similar structure is typical for any hypoeutectoid alloy. Moreover, as the carbon concentration increases, the amount of the pearlite component monotonically increases and the amount of the ferrite component decreases.
In hypereutectoid alloys, their equilibrium cooling below the solvus ES is accompanied by the formation of secondary cementite, which forms a shell around the primary austenite grain. Austenite then transforms into pearlite. Therefore, any hypereutectoid alloy with a structure of pearlite grains bordered by a shell of secondary cementite.
Tasks
1. Draw a diagram of the state of iron-cementite. Construct cooling curves for hypoeutectoid, eutectoid and hypereutectoid steel. Describe how the structure of steels is formed when cooled from a liquid state to room temperature.
2. Using a microscope, study the microstructure of hypoeutectoid, eutectoid and hypereutectoid steels in an equilibrium state. Draw the structures observed under the microscope, determine the number of phases and structural components present as a percentage, compare the microstructures of carbon and chromium-alloyed steels with the same carbon content and give a description.
3. Master the method of approximate determination of carbon in steel by microstructure.
Test tasks
1. Sketch and describe the microstructure of annealed steel grade 50 (0.5% C). Determine the quantitative ratio and composition of the phases at a temperature of 730 °C.
2. Sketch and describe the microstructure of annealed steel.
3. Sketch and describe the microstructure of steel grade U12 (1.2% C). Determine the quantitative ratio and composition of the phases at normal temperature.
4. The steel structure consists of 30% pearlite, the rest is ferrite. Draw the microstructure of steel. Determine the carbon content in it.
5. Draw and describe the microstructure of technical iron containing 0.01% C. Determine the quantitative ratio and composition of the phases at normal temperature.
6. Sketch and describe the microstructure of steel with a carbon content of 0.02%. Determine the quantitative ratio and composition of the phases at a temperature of 727°C.
7. The steel structure consists of 70% pearlite, the rest is ferrite. Draw the microstructure of steel and determine the carbon content in it.
8. The structure of the steel consists of one pearlite. Draw the microstructure of steel. Determine the amount of cementite.
9. Steel grade U10 (1.0% C) was slowly cooled from a temperature of 50 ° C above the SE line of the Fe-Fe3C diagram. Draw and describe the microstructure of steel. Determine the amount of cementite in steel at room temperature.
10. Sketch and describe the microstructure of steel grade 70 (0.7% C). Determine the amount of pearlite, ferrite and cementite in steel.
11. The structure of the steel consists of 90% pearlite, the rest is secondary cementite. Draw the indicated structure and determine the carbon content in steel.
12. The structure of hypereutectoid steel grade U13 (1.3% C) consists of pearlite and secondary cementite. Draw the indicated structure. Determine the amount of cementite in it.
13. The steel structure contains 12% cementite. Determine the carbon content, sketch the microstructure of steel.
14. The steel structure contains 5.25% cementite. Determine the carbon content, sketch the microstructure of steel.
Review questions
1. What are ferrite, austenite, cementite, pearlite?
2. How much carbon can dissolve in ferrite?
3. What do ferrite, cementite and pearlite look like when viewed under a microscope?
4. In the structure of which steels is tertiary cementite present, what is its role in the formation of the properties of steel?
5. Which steels contain secondary cementite in their structure?
6. Under what conditions does secondary cementite in hypereutectoid steels form a continuous layer (mesh) along the boundaries of pearlite grains, and how does this affect the properties of steel?
7. At what carbon content does pearlite appear in the structure of carbon steel?
8. What structural components are contained in the structure of iron-carbon alloys with a carbon content of up to 0.02%?
9. How does the structure of hypoeutectoid steels change with increasing carbon content?
10. How to approximately determine the carbon content in steel based on the amount of pearlite?
11. What structural components are present in the structure of hypereutectoid steels?
12. How and why do the properties of carbon steels change in an equilibrium state with increasing carbon content?
Literature
1. Arzamasov B.I. Materials science technology of structural materials. M: Publishing House, 2007.
2. Sirotkin O.S. Theoretical foundations of general materials science, Kazan KGEU, 2007, 348 p.
3. Laboratory workshop on materials science. M.: Publishing house MPEI, 1998.
Laboratory work No. 3
Nodal critical points of the iron-carbon system state diagram
On the iron-carbon diagram there are a number of points called critical points. Each point carries information about temperature, carbon content and a description of what exactly is happening in that place.
There are 14 of these critical points in total.
For example, A, says that at a temperature of 1539 ° C and at zero carbon content, pure iron melts. D indicates that at a temperature of 1260 Fe3c can melt.
The points are located at the intersection of lines placed on the diagram.