State diagrams of two-component systems. Phases, structures
Alloys consist of two or more elements of the periodic table.
The elements that form alloys are called components. The properties of the alloy depend on many factors, but, first of all, they are determined by the composition of the phases and their quantitative ratio. Knowing the state diagram, you can imagine the full picture:
- formation of the structure of any alloy;
- determine the optimal temperature for pouring the alloy to produce cast parts;
- evaluate the fluidity of the selected alloy and the possibility of obtaining chemical heterogeneity;
- make a conclusion about the possibility and conditions of pressure treatment;
- determine the heat treatment regime required for a given alloy.
Basic definitions.
The phase diagram is a graphical representation of the phase composition of alloys of a given system as a function of temperature and chemical composition of the alloy (Fig. 1, Fig. 2)
Fig.1 Method for constructing state diagrams
Fig.2 Experimental setup for constructing phase diagrams
where: 1 – oven; 2 – crucible; 3 – molten metal; 4 – hot junction; 5 – thermocouple; 6 – cap; 7 – cold junction; 8 galvanometer
Experimentally constructed phase diagrams are checked according to the phase rule, which makes it possible to theoretically substantiate the direction of the transformation processes to establish the equilibrium state of the system.
The phase rule makes it possible:
- predict and test the processes occurring in alloys during heating and cooling;
- it shows whether the crystallization process occurs at a constant temperature or over a temperature range;
- indicates how many phases can exist simultaneously in the system.
The phase rule is expressed by the following equation:
C = K + 1 – F
where: K – number of components in the system; Ф – number of phases; C – number of degrees of freedom (or system variation). The number of degrees of freedom is the number of independent variables of internal (phase composition) and external (temperature, pressure) factors that can be changed without changing the number of phases in equilibrium.
State diagram of alloys, the components of which are completely soluble in liquid and solid states (Fig. 3).
Having a phase diagram, you can trace the phase transformations of any alloy and indicate the composition and quantitative ratio of the phases at any temperature.
This is done using two simple rules (Fig. 4):
- Concentration rule – rules for determining the composition of phases;
- The rule of segments is a rule for determining the quantification of phases.
Fig. 3 Phase diagram with unlimited solubility and cooling curves for alloys and pure components
Fig.4 Application of the concentration rule and the segment rule
State diagram of alloys, the components of which are limitedly soluble in the solid state and form a eutectic (Fig. 5).
Fig.5 Construction of cooling curves for a diagram with limited solubility and with eutectic
State diagram of alloys with limited variable solubility of components in the solid state (Fig. 6).
Fig.6 Construction of cooling curves for a diagram with limited variable solubility
State diagram of alloys, the components of which are limitedly soluble in the solid state and form peritectics (Fig. 7)
Fig.7 Construction of cooling curves for diagrams with peritectics
State diagrams of alloys, with polymorphic and eutectoid transformation of components (Fig. 8)
Eutectoid transformation : γE → αK + βF
Fig.8 Construction of cooling curves for a diagram with a polymorphic transformation
State diagrams of alloys, the components of which form chemical compounds (Fig. 9)
Fig. 9 State diagram, the components of which form chemical compounds
Physical and mechanical properties of alloys in an equilibrium state.
The properties of alloys are largely determined by the phase composition, which can be judged from the phase diagram (Fig. 10). The technological properties of solid solutions are of great practical interest.
Alloys in the state of solid solutions are well processed by pressure and difficult by cutting. The casting properties of solid solutions are, as a rule, unsatisfactory. Eutectic alloys have the best fluidity.
Intermediate phases in most cases have high hardness, melting point and brittleness (carbides, nitrides, borides, oxides, etc.).
The regularities noted by N.S. Kurnakov are the basis for the development of alloy compositions with specified properties.
Thus, in addition to classifying crystals by type of bond, classification by type of crystal lattice is used. This classification makes it possible to predict the nature of changes in the properties of the alloy as a function of composition.
Fig. 10 Relationship between the properties of alloys and the type of phase diagram (N.S. Kurnakov’s rule)
Areas of application
This material is used in various industries:
- Mixtures and homogeneous metal are used in mechanical engineering. Internal parts, housings, and moving mechanisms are made from them.
- Shipbuilding, aircraft manufacturing, rocketry.
- Construction - production of fasteners, consumables.
- Instrument making - manufacturing electronics for the home.
- Radioelectronics - creation of elements for electrical appliances.
- Medicine, machine tool building, chemical industry.
- Making weapons.
If a homogeneous material is not suitable for something, compounds based on it, the characteristics of which differ significantly, will do.
Diagram Fe – C (Fe – Fe3С)
Among the state diagrams of metal alloys, the most important is the state diagram of the Fe – C system (Fig. 11). This is explained by the fact that iron-carbon alloys are most widely used in technology.
There are two Fe–C diagrams:
- metastable Fe – Fe3C;
- stable Fe – Gr.
Fig. 11 Structural diagram of iron-carbon states
Iron and carbon are components. Iron with a melting point of 1539 ° C has modifications - α and γ. The Fe α exists at temperatures up to 911°C and from 1392°C to 1539°C , and has bcc lattice. An important feature of Feα is its ferromagnetism below a temperature of 768°C , called the Curie point.
Feγ modification in the temperature range from 911 to 1392°C has fcc lattice. When Feα into Feγ , the volume of iron decreases by approximately 1% . Feγ – paramagnetic (Fig. 12).
The bcc ↔ fcc transition is called a polymorphic transformation.
Fig. 12 Temperature polymorphism of iron
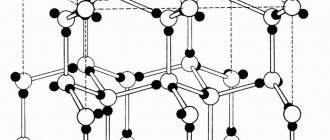
Carbon exists in two modifications: graphite and diamond. Under equilibrium conditions, graphite is stable ; at high pressures and temperatures, diamond becomes stable.
Phases in iron-carbon alloys (Fig. 13, Fig. 14):
- liquid solution;
- ferrite – F;
- austenite – A;
- cementite – C;
- free carbon in the form – Gr.
Determination of phases in iron-carbon alloys
Fig. 13 Phases in iron-carbon alloys
Fig. 14 Crystal lattices: a – diamond, b – graphite, c cementite
Transformation in alloys of the Fe – C system:
The first critical point is the beginning of crystallization (liquidus). These points for various alloys are located on the ABCD line (see Fig. 11).
The second critical point is the end of crystallization (solidus). These points for various alloys are located on the ANJECF line.
Iron-carbon alloys are divided into two groups (Fig. 11):
- steel - an alloy of iron and carbon, where carbon contains up to 2.14%;
- cast iron is an alloy of iron and carbon, where the carbon content is more than 2.14%.
isothermal transformations occur
- in steels – peritectic and eutectoid (Fig. 15, Fig. 16, Fig. 17),
- in cast iron – eutectic (Fig. 22)
Fig. 15 Cooling curves for steels with peritectic transformation
Fig. 16 Cooling curves for a diagram with eutectoid transformation
Most technological operations (heat treatment, steel pressure treatment, etc.) are carried out in the solid state, so transformations of steels at temperatures below crystallization temperatures (below the NJE ) are considered in more detail.
Figure 17 shows transformations in steels during cooling, their structures and markings of these steels.
Steel 40 is a structural, carbon, quality steel with an average carbon content of 0.40%. Structure – ferrite + pearlite.
U8 – tool, carbon, high-quality steel with an average carbon content of 0.8%. Structure – lamellar perlite.
U12 – tool, carbon, high-quality steel with an average carbon content of 1.2%. Structure of perlite + cementite mesh.
Fig. 17 Cooling curves and steel structures
NOTE: Cementite released from the liquid is called primary; cementite released from austenite – secondary; cementite released from ferrite is tertiary.
After mastering the material, transformation in steels during cooling, the student must independently describe the structures of hypoeutectoid and hypereutectoid steels (see Fig. 18 and Fig. 19).
Fig. 18 Microstructures of hypoeutectoid steels
Fig. 19 Microstructures of eutectoid and hypereutectoid steels
On the Fe – C diagram, in addition to the critical points liquidus (beginning of crystallization) and solidus (end of crystallization), there are also a number of designations for critical points (Fig. 20).
Fig. 20 Designations of critical points on the Fe - C diagram. The properties of steels are strongly influenced by - carbon content
yes, impurities and steel testing temperature (Fig. 21).
Fig. 21 Effect of carbon and impurities on the properties of steels
Iron-carbon alloys with eutectic transformation (cast irons)
The carbon content in these alloys is more than 2.14% (Fig. 22).
Fig. 22 Cooling curves for alloys with eutectic transformation
In alloys with a carbon content of more than 2.14% C, a eutectic transformation occurs during crystallization.
Such alloys are called white cast iron.
An alloy with a concentration of 4.3% C - eutectic white cast iron crystallizes at eutectic temperature isothermally with the simultaneous separation of two phases: austenite of point E composition and cementite. The resulting mixture of these alloys at T = 1147°C is called ledeburite (Fig. 23).
With further cooling, the carbon concentration in austenite changes along the ES due to the release of secondary cementite and takes on a value of 0.8% at the eutectoid transformation temperature. PSC line temperature, austenite in ledeburite undergoes a eutectoid transformation into pearlite.
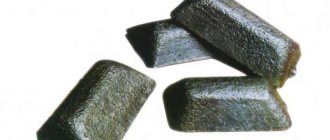
Fig. 23 Microstructures of white cast irons Iron-carbon alloys can crystallize in accordance with
iron - graphite diagram only with very slow cooling and the presence of graphitizing additives Si, Ni, etc. (Fig. 24). Such alloys are called gray cast iron (Fig. 25).
Fig. 24 State diagram of the iron – graphite system
Depending on the shape of the graphite inclusions, gray cast iron is called: ordinary gray cast iron, malleable cast iron and high-strength cast iron (Fig. 25).
Fig. 25 Structure of gray cast iron
Figures 26, 27 and 28 show the markings and metal base of gray cast irons.
Fig. 26 Microstructure and marking of gray cast iron
Fig. 27 Graphitization mode of white cast irons, microstructure and marking of malleable cast irons
Fig. 28 Microstructure and marking of high-strength cast iron
Malleable cast iron is produced by annealing white cast iron, this annealing is called graphitization of white cast iron. Graphitization is divided into several stages during which cementite completely decomposes into graphite.
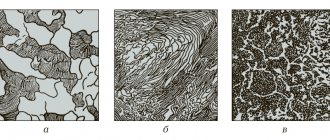
Figure 29 shows the structures of iron-carbon alloys (ferrite - a, hypoeutectoid steels - b, c, eutectoid - d, structures of white cast iron - f, g, h)
Fig. 29 Microstructures in iron-carbon alloys
Influence of alloying elements on the equilibrium structure and properties of steels.
The following elements are most often used as alloying elements: Cr, Ni, Mn, Si, Mo, W, V, Ti, Co, Nb . Less commonly used are Al, Cu, B and some others.
Almost all alloying elements change:
- temperature of polymorphic transformations of iron;
- temperature of eutectoid and eutectic reactions;
- solubility of carbon in austenite;
- interactions with carbon form carbides;
- interactions with each other or with iron form intermetallic compounds.
Based on their effect on temperatures A3 and A4 , alloying elements can be divided into two groups:
- the first group includes elements that lower A3 and increase A4 . These include Ni , Mn, C, N, etc. Such alloys are called austenitic steels (Fig. 30);
- the second group includes elements that increase A3 and decrease A4 . Most of these elements are Cr, Mo, W, V, Si, Ti, etc. Such alloys are called ferritic steels (Fig. 31)
Fig. 30 Steels alloyed with the first group of elements (austenitic steels)
Fig. 31 Steels alloyed with the second group of elements (ferritic steels)
One group of alloying elements does not form carbides, and another group of alloying elements can form carbides (special carbides), in addition, they can interact with cementite forming alloyed cementite (Fig. 32).
Alloyed cementite is usually written as (Fe, Cr)3 C or (Fe, Mn)3 C or in the general form Me3C .
Strong carbide formers – Mo, W, V, Ti – form interstitial phases with carbon. In this case, most often carbides have the formula MC or M2C . Interstitial phases, characterized by very high refractoriness, are practically insoluble in austenite. To disintegrate and dissolve such phases, steel must be heated to temperatures of ~ 1300°C . Due to the insolubility of interstitial phases, austenite is depleted in carbon when steel is alloyed with strong carbide formers.
Fig. 32 Interaction of alloying elements with carbon
Alloying elements affect the temperatures of phase transformations of steels during heating and the composition of points S and E of the diagram (Fig. 33).
Fig. 33 Influence of alloying elements on the critical points of steel
Under the influence of alloying, the position of the nodal concentration points of the Fe – C diagram changes. Most alloying elements reduce the solubility of carbon in austenite at all temperatures, which is equivalent to a shift of the SE to the left, towards lower carbon concentrations.
The maximum solubility of carbon in austenite (point E ) decreases most sharply under the influence of elements closing the γ region in carbon-free alloys: Cr, Si, W, V, Ti . It is obvious that in the presence of these alloying elements, ledeburite will appear in the alloy structure at lower carbon concentrations than in non-alloyed iron-carbon alloys. For example , in steel alloyed with 10–11% Cr , ledeburite appears in the structure at a carbon content of ~ 1%. It is characteristic that a small amount of ledeburite eutectic with a low carbon content does not reduce the ability of the alloy to be processed by pressure in a hot state, while unalloyed white cast iron (C> 2.14%) loses the ability to be processed by pressure even with small amounts of the eutectic component structure.
In this regard, alloy steels containing a ledeburite component are classified as steels and not white cast irons and are classified as ledeburite.
Metal production
There are several ways to get iron:
- Direct methods. This is the production of sponge iron in shaft and tunnel furnaces. Production of iron dough in rotary kilns. It is possible to obtain iron in fluidized bed reactors and the chemical-thermal method.
- The blast furnace process is a common method. Iron ore and flux are reduced by carbon from coke, resulting in cast iron. If necessary, impurities (phosphorus, sulfur) and excess carbon are removed from cast iron in open-hearth furnaces or converters. Alloy steel is produced in electric furnaces (ESF).
- Chemically pure iron can be obtained from a solution of its salts using electrolysis.
The influence of plastic deformation on the structure and properties of a deformed alloy.
The set of phenomena associated with changes in the mechanical, physical and other properties of metals in the process of plastic deformation is called strain hardening or cold hardening. Hardening during work hardening is explained by an increase in dislocation density by several orders of magnitude.
With an increase in the degree of deformation, the plasticity characteristics (relative elongation, relative contraction) and viscosity (impact strength) decrease, and the strength characteristics (elastic limit, yield strength, tensile strength and hardness) increase (Fig. 34)
Fig. 34 Influence of the degree of deformation on the mechanical properties of the metal
When the crystal lattices of most grains still receive the same orientation, a deformation texture (Fig. 35)
A
b
Fig. 35 Effect of plastic deformation on the microstructure of metal: a – diagram, b – microstructure of deformed metal
The deformed metal is in a nonequilibrium state. The transition to an equilibrium state is associated with a decrease in distortions in the crystal lattice and the release of stress, which is determined by the possibility of movement of atoms.
At low temperatures, the mobility of atoms is low, so the cold-hardened state can persist indefinitely.