What is bronze?
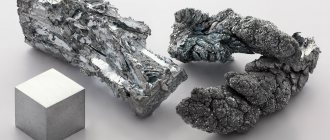
Bronze is an alloy of copper and tin. In addition to this, metallurgical bronzes usually contain several more alloying additives. Electroplated bronzes are almost always two- or three-component, with zinc often acting as the third component. Today, bronze coatings have limited industrial use compared to tin, zinc or nickel. In many ways, the historical factor had an impact here, because Previously, nickel was scarce and its replacement with white bronze was economically justified, despite the fact that bronze plating itself is more complex than nickel plating. Today the situation has changed - nickel and tin are equally accessible to enterprises and are approximately in the same price category. But, nevertheless, galvanic bronzes have a number of unique properties, because of which they have the right to life. Galvanic bronzes themselves are divided into white (Sn 40-50%) and yellow (Sn 10-20%). This article will discuss the process of deposition of white bronze.
How to paint a chrome part
Chrome parts are a rather controversial element of car decor, due to its obvious garishness. Many car enthusiasts consider themselves ardent opponents of chrome parts and try in every possible way to camouflage such decorations of car manufacturers by covering them with film or painting. Those who are comfortable with chrome are also often forced to mask the decor due to scratches or cracks on it. Yes, chrome plating is not a particularly durable coating and often rubs off or even swells on radiator grilles, which looks very unflattering.
General information about galvanic white bronzes.
Electroplated white bronzes are further divided into two main subtypes: • Two-component (copper-tin). A composition with 40% tin is considered classic, although this figure can fluctuate between 35-50%; • Three-component (copper-tin-zinc). The composition with 7% zinc is called Trialloy. White bronze coatings have a number of common properties: • Any white bronze is resistant to corrosion in normal air atmosphere. • When heated to 300o C in air, they oxidize.
Figure 1 - The result of thermal oxidation of white bronze on an aluminum contact with a nickel-phosphorus sublayer. Heating is performed by welding the contact to an aluminum busbar.
• The porosity of white bronze coatings is less than that of nickel at similar thicknesses. • White bronzes have a high light reflectivity and can be used in reflectors. • In sulfur-containing industrial atmospheres, white bronzes have a much more stable contact resistance than silver, which determines their main area of application - protecting electrical contacts. • Electrodeposited white bronze acts as a cathode to the brass in seawater, so it should not have pores or damage extending to the base.
There are a number of differences between two- and three-component white bronze: • In the absence of zinc, white bronze is closer in color to tin, with zinc - closer to nickel. Zinc-containing bronzes have bright shiny surfaces even at tin concentrations well below 20% by weight. • Based on a combination of parameters, zinc-containing bronzes are deposited 40% faster than the corresponding binary alloys. • Zinc-containing bronzes are less porous than zinc-free bronzes. • High-tin binary bronze is harder than ternary alloys, making them a preferred choice when resistance to scratches, wear and erosion is required. • Zinc-containing white bronzes have found application in the coating of high-frequency electrical contacts (Figure 2).
Figure 2 - Examples of high-frequency electrical contacts coated with white bronze. • The potential of two-component bronze is more cathodic to brass than that of three-component bronze. • The anodic polarization resistance of two-component bronze is higher than that of a three-component alloy. • In two-component bronze, corrosion occurs locally, in three-component bronze it occurs evenly and uniformly. • In a marine environment, the corrosion resistance of two-component bronze is higher than that of three-component bronze. The thermal equilibrium diagram of bronzes (Figure 3) is complex.
Figure 3 —
Thermal equilibrium diagram of bronzes. There are a number of possible phases that are not necessarily equilibrium phases that are stable at room temperature. A large number of nonequilibrium and intermetallic phases exist up to 50% tin. The galvanic deposition of bronze itself is also a nonequilibrium process, which further complicates matters. That is, the electrodeposited alloy may contain phases that are usually not stable at room temperature.
Early X-ray diffraction studies by Bechard and later by Raub and Sotter confirmed that the phases in electrodeposited bronzes existed in a wider range of compositions than those found in metallurgical bronzes. The fundamental point in the deposition kinetics of classical white bronze is the high difference between the standard potentials of copper and tin. An even more difficult case is the deposition of a three-component alloy, because All three metals have very different potentials. This circumstance means that without the use of ligands and functional additives, coprecipitation of copper, tin, and, especially, zinc will be impossible. The most popular ligands are cyanide.
The operating current density plays a major role in the composition of the resulting alloy. In general, the relationship between current density and alloy composition in irregular coprecipitation is complex and usually unpredictable. During normal coprecipitation, Cu is deposited at a more positive potential than Sn; during anomalous coprecipitation, the opposite is true. However, CTJLowetal. demonstrated that both normal and abnormal alloy deposition can be achieved depending on the concentration of copper and additives in the baths.
Raub and Sautter showed that the hardness of galvanized bronzes reaches a maximum of about 550 VHN at 40% Sn. That is, the first factor here is the composition of the alloy. This is in agreement with studies carried out by Ramanathan, who obtained a maximum hardness of 520 VHN for the same composition. Menzies discovered that the microhardness of bronzes increased with increasing bath temperature. Maximum hardness was obtained from a cyanide bath at 70°C, although this precipitate did not have the highest tin content. Thus, the hardness of galvanized bronzes is also related to the temperature of the bath, and not just to the composition or structure of the coating.
Process Features
The coating formed on the workpiece using galvanization can be applied for technological purposes or perform decorative, protective, or both functions at once. For decorative purposes, a thin layer of gold or silver is created, and to ensure reliable protection of the surface of the workpiece from corrosion, galvanizing or galvanic copper plating is performed.
Electrolysis process diagram
It is not difficult to do electroplating even at home. This procedure is performed as follows.
- Two anodes are lowered into a dielectric container with electrolyte, connected to the positive contact of the electric current source. The material used to manufacture such anodes must be metal, the layer from which must be formed.
- Galvanization, that is, the process of transferring metal molecules from the electrolyte to the cathode product, begins to occur at the moment when the resulting electrical network is closed.
The workpiece itself, connected to the negative terminal of the electric current source and thus acting as a cathode, is placed in the electrolyte between the anodes.
As a result, a thin and uniform layer of metal is formed on the treated surface, which was originally contained in the chemical composition of the electrolyte.
Galvanic installation diagram
Deposition of bronze from a simple electrolyte without additives.
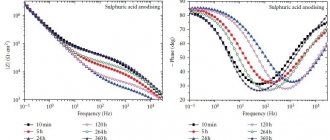
The impossibility of depositing bronzes from simple baths without additives is confirmed experimentally. Figure 4 shows cyclic voltammetry curves for deposition from electrolytes containing copper, tin, and simultaneously copper and tin. No additives other than sulfuric acid and ligands were introduced into the electrolyte. The process was carried out on a steel rotating disk electrode at speeds of 0, 100 and 500 rpm.
Figure 4 - Cyclic voltammograms on a steel rotating disk electrode in electrolytes: a - 0.1 M CuSO4, b - 0.1 M SnSO4, c - 0.1 M CuSO4 + 0.1 M SnSO4. In all cases, 1.4 M H2SO4 was introduced into the electrolytes. No additives were used.
The curves clearly show two potentials: the beginning of reduction and anodic dissolution of the indicated metals. The reduction of Cu2+ to Cu0 began in the range from -0.017 to -0.112 V, depending on the electrode rotation speed (Figure 4a). With anodic polarization, single current jumps were observed, appearing at 0.05 V and having different peak areas.
In the case of tin (Figure 4b), the onset of reduction potential ranged from -0.464 to -0.414 V, depending on the electrode rotation speed. After the start of the process, the current density increased abruptly at -0.5 V and subsequently decreased. When copper and tin were present together in the electrolyte without additives (Figure 4c), the first onset potential for copper reduction was -0.022 V at 0 rpm, -0.134 V at 100 rpm, and -0.196 V at 500 rpm. The maximum current was reached at -0.48V. With further cathodic polarization from -0.5 V, the current density increased again, which indicated the beginning of tin reduction. Thus, in the mixed solution, two clearly separated current jumps were detected on the cathode branches of the voltammogram, characterizing the reduction of copper and tin. This means that there was no co-precipitation and no bronze was formed.
Since copper is preferentially reduced due to its more positive standard potential, in the electrolyte without additives or ligands, much more copper was deposited at the cathode than tin. This is consistent with the scanning profile in the anodic polarization mode. Large anodic dissolution peaks were found in the range of 0.18 to 0.28 V in the copper-only electrolyte (Figure 4a) and from -0.44 to -0.38 V in the tin-only electrolyte (Figure 4b). In the mixed solution, very small peaks were observed between -0.45 and -0.42 V and a large peak at 0.167 V. Thus, this is further evidence that electrochemical reduction in the mixed Cu/Sn solution mainly leads to deposition copper
How to properly prepare the product for the procedure
After you have made your electroplating apparatus, found all the necessary equipment and chemical components, you can begin such an important process as preparing the product that will be subjected to electroplating. The importance of such a process is very difficult to overestimate, since the quality of its implementation largely determines what characteristics the finished coating will have.
In most cases, preparing a product for electroplating is not limited to just cleaning its surface from dirt and degreasing it. Sandblasting and subsequent grinding using sandpaper and special pastes are also performed.
White bronzing cyanide electrolyte.
This type of bath is probably the most widely studied and has the greatest commercial importance. The composition of the bath includes copper cyanide complexes with an excess of free sodium or potassium cyanide, as well as hydroxides and stannates in varying quantities, depending on the composition of the desired precipitate. Potassium cyanide is superior to sodium in terms of electrical conductivity. The main disadvantages of cyanide baths are toxicity and the tendency to carbonate in air. The last factor is especially aggravated if the bath operates with strong heat. Brightening agents play an important role in these baths and can affect the kinetics of the process and the physical properties of the sediments. When appropriate additives are added from cyanide electrolytes, smooth, bright and almost mirror-like bronze coatings are formed. Supplements can be inorganic or organic in nature and many are coded and patented.
4.1 Effect of temperature.
It has been established that an increase in temperature increases the current output of the coating, increases the tin content in the deposit and its hardness. However, when heated, sodium cyanide decomposes much more quickly, especially at temperatures above 65°C. At temperatures below 40°C, tin almost does not precipitate and deposits are formed, consisting mainly of copper.
4.2 Effect of current density.
As the current density increases, the current efficiency decreases sharply. When depositing white bronze, the range of permissible current densities is narrower than for yellow bronze.
It has been established that the composition of the alloy obtained at different current densities changes, but unevenly. Some researchers reported that as the current density increases, the tin content in the deposit increases, but there were also opposing opinions.
4.3 Effect of cyanide and hydroxide concentrations.
With an increase in the concentration of cyanides and hydroxides in the bath, a noticeable decrease in the cathode current efficiency occurs. It was found that increasing the content of free hydroxides in the bath significantly reduces the rate of tin deposition, but has almost no effect on the rate of copper deposition. Increasing the free cyanide content significantly reduces the rate of copper deposition and has a much smaller effect on the rate of tin deposition. This can be summarized as follows: increasing the hydroxide content decreases the tin content of the coatings, while increasing the cyanide content increases it.
4.4 Effect of metal concentration in the bath.
A significant increase in the tin content in the bath leads to an increase in the amount of tin in the coating by only a few percent. Increasing the concentration of metals in the bath generally increases the current efficiency.
4.5 Effect of carbonate in galvanic baths.
Carbonates accumulate in a cyanide bath in a variety of ways. They can be formed by the reaction of atmospheric carbon dioxide with hydroxides or by its reaction with decomposing cyanides in the presence of oxygen. Carbonates can also form at the anode during the decomposition of cyanide.
It has been established that a certain amount of carbonate has a beneficial effect on the deposition process of white bronze by increasing the electrical conductivity of the solution and, thus, increasing the dissipative power. It has been established that potassium carbonate content up to 100 g/l increases the RS of bronze baths. A further increase in potassium carbonate content above this value leads to a decrease in RS.
An increase in the potassium carbonate content in the galvanic bath also leads to a decrease in current efficiency.
4.6 Electrode reactions in a cyanide bronzing bath.
It is generally accepted that tin is precipitated from solution by means of simple ions that are formed during hydrolysis or dissociation of the stannate complex:
SnO32- + 3H2O → Sn4+ + 6OH-
then:
Sn4+ + 4e → Sn0
Direct discharge of the complex is also possible:
SnО32- + 3H2О + 4e → Sn0 + 6ОH-
The above reaction shows that for every tin atom precipitated there are six hydroxyl ions. This leads to an excessive increase in pH in the diffusion layer of the cathode. The dissociation of the copper cyanide complex proceeds according to the reaction:
Cu(CN)32- → Cu+ + 3CN-
Cu+ + e → Cu
The first reaction of dissociation is not as simple as it may seem. Changing the concentration of free cyanide in solution has an unusual effect on the electrode potential. As the solution dilutes, it would be reasonable to expect that the electrode potential would become more negative or less noble, as for electrodes in solutions of simple ions. However, the electrode potential for copper becomes more positive (more noble) as the cyanide solution becomes more dilute. One theory explains that as the cyanide concentration changes, different electrode reactions occur and the observed potential is a mixture of potentials associated with several discharge reactions. A number of complexes formed when the concentration of cyanide in solution increases can be as follows:
Cu(CN)2- → Cu(CN)32- → Cu (CN)43-
All of these complexes exist in solution and their potential increases with the number of cyanide ligands. Thus, the potential becomes more negative as the cyanide content of the bath increases.
Nickel plating
Coating metal with a layer of nickel at home can be done as a finishing treatment or before chrome plating. This process is called “galvanostegy”, since a layer of nickel applied to the surface of the product increases its resistance to negative environmental factors. In addition to its high protective properties, the nickel layer is also distinguished by its decorative appeal.
The electrolyte temperature when performing nickel plating does not exceed 25°, and the current density is within 1.2 A/dm 2. The electrolyte, the acidity of which should be within 4–5 pH, is an aqueous solution containing chemical elements such as nickel sulfate, magnesium, sodium, table salt, and boric acid.
After the electroplating process is completed, the product is removed from the electrolytic solution, washed in water, thoroughly dried and polished.
Non-cyanide electrolyte, white two-component bronzing.
When a number of additives are introduced into a sulfuric acid non-cyanide bronzing solution, the kinetics of coating deposition changes. Cyclic voltammetry in an electrolyte with four functional additives was carried out at a scan speed of 50 mV/s and a steel disk electrode rotation of 100 rpm. Figure 5a shows the curves obtained in a solution containing two special additives.
Figure 5 —
Polarization curve of deposition of a copper-tin alloy in an electrolyte consisting of 0.1 M CuSO4 and 0.1 M SnSO4 in 1.4 M H2SO4 with: a - individual additives, b - with a chelating ligand, c - with an anti-pitting additive.
With the introduction of additives, the potential for the onset of copper reduction shifted to a more negative value, and the limiting current density decreased. Theoretically, the additives introduced in the study do not dissociate in the bath at pH <1.0, which is well below their pKa values. However, Cu2+ complexes can form with them in the cathode region, where the pH is higher due to the release of hydrogen.
According to Figures 5b and c, in the presence of a chelating agent or antipitting additive, the copper reduction onset potential shifted toward the tin liberation potential. At the same time, the tin reduction potential did not change and was equal to -0.484 V, regardless of the presence of these components. The overall limiting current density decreased.
Figure 6a shows the results of measurements in the potential range from 0.6 to -0.6 V in an electrolyte containing two complex additives, a chelating ligand and an antipitting additive. It can be seen that reduction began at about -0.2 V, with a large current peak appearing around -0.43 V. In this graph, the onset of tin reduction potential intersected with the copper reduction potential, indicating the possibility of alloy formation.
Figure 6 - Cyclic voltammograms of the deposition of a copper-tin alloy in an electrolyte consisting of 0.1 M CuSO4 and 0.1 M SnSO4 in 1.4 M H2SO4 with all additives: a - the entire curve, b - an increase in a separate area of the curve.
When scanning into the anodic region, large current peaks were visible at -0.5 V (tin) and 0.13 V (copper), respectively, indicating successful deposition of Cu-Sn under these conditions. In contrast to the deposition of copper and tin without additives, where the peak area of copper dissolution significantly exceeded the peak area of tin dissolution. In addition, the reduction potentials were practically unaffected by the rotation speed of the disk electrode. Those. the effect of mass transfer during bronze deposition in an electrolyte with additives was insignificant (Figure 4b).
Figure 7 shows the colors of bronze coatings as a function of current density and plating time.
Figure 7 —
The influence of current density and deposition time on the color of the resulting bronze.
It can be seen that an increase in current density leads to a change in the color of the coating from white to red. This means that with increasing current density, the proportion of deposited copper in the alloy increases.
Figure 8 shows electron microscopy images of the Cu-Sn surface after electrolyte deposition with all four additives.
Figure 8 - SEM images of the surface of Cu-Sn alloy coatings deposited in a mixed solution, depending on the current density at A/dm2: a - 0.5, b - 1, c - 2, d - 3, e - 5, f - 6. Depending on time at 1 A/dm2: g - 10 minutes, h - 20 minutes and i - 45 minutes.
They show a compact structure and uniform surface morphology, and the grain size increased simultaneously with the current density (Figure 8a-f) and deposition time (gi).
A cross-sectional image of this coating is shown in Figure 9a. It can be seen that the coating is compact and homogeneous, and this is consistent with previous data.
The results of the EDS analysis of this thin section with mapping are shown in Figure 9 (Cu and Sn). Both copper and tin show uniform distribution throughout the section without agglomerations.
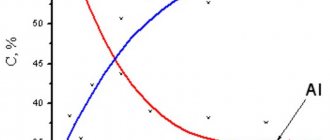
Figure 9 - Complex data: a - SEM image of the cross section of a Cu-Sn alloy film deposited at 1 A/dm2 for 30 minutes with EDS results of a section for copper and tin; b,c - graph of copper and tin content on the surface of the Cu-Sn alloy coating as a function of current density and deposition time, respectively.
Figure 9b shows that at the minimum current density, an alloy with 50% tin is deposited. This fraction constantly decreases, reaching 35% as the current density increases, which is in good agreement with the result of assessing the color of the coating (Figure 7). Thus, it is the Sn/Cu ratio that influences the bright white color of the surface, rather than the grain size and thickness related to current density.
Based on X-ray phase analysis (Figure 10), it can be concluded that Cu-Sn alloy films mainly consist of copper and tin with inclusions of Cu6.26Sn5 and Cu6Sn5 intermetallic compounds for all samples, regardless of the current density.
Figure 10 - X-ray diffraction patterns of Cu-Sn alloy films deposited at current densities from 0.5 to 6 A/dm2 in a mixed solution with four functional additives.
As the current density increases, the intensity of the peaks at the angles of 42.6° and 78.6°, which correspond to the intermetallic compounds Cu6.26Sn5 / Cu6Sn5 (JCPDS cards No. 47-1575 and No. 45-1488) and tin oxides SnO/SnO2 (JCPDS cards No. 06 -0395 and No. 41-1445), gradually decreased. This was due to an increase in the amount of Cu/Cu2O and a decrease in the amount of metallic Sn on the coating surface. This result is consistent with the results of EDS analysis.
The surface composition of the Cu-Sn alloy can be clarified based on XPS analysis, the results of which are shown in Figure 11. The high-resolution spectra of Cu 2p3/2 mainly showed Cu0/1+ peaks at 933.0 eV (0.5 A/dm2) and 932.7 eV (6 A/dm2) with a very small manifestation of Cu2+. This means that the surface layer of the Cu-Sn alloy is mainly dominated by Cu2O/Cu. At higher current densities, the Cu 2p3/2 peak shifted slightly towards lower binding energies due to the higher proportion of copper in the Cu-Sn composition.
In contrast, in the case of Sn 3d5/2, Sn4+ was mainly detected at 486.7 eV, which means that SnO2 is mainly formed on the outer, surface layer of Cu-Sn by spontaneous oxidation of tin. Moreover, the Sn4+ peak was practically independent of the current density. The Sn00 peak at an intensity of 485.3 eV decreased with increasing current density.
Thus, it can be assumed that at current densities above 3 A/dm2, the uppermost layer of the Cu-Sn coating mainly consists of Cu2O/SnO2. At current densities below 2A/dm2, the outer layer is represented by a pure Cu-Sn alloy, which corresponds to Figure 7, where a bright white color was observed precisely at low current densities.
Figure 11 - High-resolution XPS spectra for Cu-Sn coatings deposited at current densities from 0.5 to 6 A/dm2 in a mixed solution.
The corrosion resistance of Cu-Sn coating on steel was assessed by polarization tests in a 0.1 M NaCl solution. Figure 12 demonstrates that the corrosion current is clearly influenced by the current density at which the alloy was deposited.
Figure 12 - Corrosion curves of Cu-Sn coating deposited on steel at different current densities. The corrosive medium is 0.1 M NaCl solution. The Cu-Sn alloy deposited at a current density of 1 A/dm2 showed better corrosion resistance. The compact and homogeneous surface may have contributed to this. It is also important that higher current densities lead to a deficiency of tin in the coating or to the formation of oxidized forms of tin, such as SnO and SnO2, which also contributes to the deterioration of the corrosion resistance of the coating.
More details about the corrosion resistance of white bronze are described in the article.
Bronzing metal at home
Oxidation and bronzing of metals
- Acetic-copper salt (in crystals) 5 g;
- Ammonia 7 g;
- Acetic acid 3 g;
- Water 85 g.
Copper objects to be brown oxidized are heated strongly on coals, then immersed in the specified composition or coated with it, and then covered with a solution of 1 wt. tsp Wax 4 wt. including turpentine oil.
- Nickel sulfur salt 100 g;
- Berthollet salt 200 g;
- Copper sulfate 900 g;
- Potassium permanganate salt 10 g;
- Water 5 l.
- Ammonium chloride 30 g;
- Sour oxalic salt 10 g;
- Acetic acid 0.25 l.
The cleaned items are rubbed with a soft brush or linen rag with this solution until the area being rubbed is completely dry.
The operation is repeated until the desired shade is achieved.
10 g of ammonium thiocyanate are dissolved in 100 cm3 of water, then 10 g of ammonia (specific weight 0.91) and a solution of 3 g of copper sulfate in 9 cm3 of water are added. The item is placed in the solution for 5 hours.
Features of galvanic white bronzes with zinc.
As mentioned earlier, the composition, structure and properties of white bronzes with and without zinc are different. For convenience, data relating to zinc-containing bronze is presented in comparison with zinc-free bronze. Figure 13 shows electron microscopy images of thin white bronze coatings with and without the introduction of zinc. Zinc-free images show features smaller than 50 nm. Such nanostructures are the result of the introduction of additives that inhibit crystal growth and promote grain refinement. As a result, the surface roughness becomes much smaller than the wavelength of light. Bronze films containing zinc, on the contrary, have much less noticeable nanostructures. In particular, the surface appears to be coated with an incoherent layer that, when held under an electron beam, rapidly changes shape, indicating high carbon contamination that cannot be removed from the surface. This is due to the chemical nature of the additives, which leads to more surface impurities in zinc-containing bronzes.
Figure 13 —
SEM images of the surface morphology of Zn-containing white bronze (a, c, e, left column, respectively, with a thickness of 0.5, 1.0 and 1.5 μm) and Zn-free white bronze (b, d, f, right column, respectively) thickness 0.5, 1.0 and 1.5 microns).
Microimages of transverse sections are given in Figure 14.
Figure 14 —
Microimages of coatings 1.5 µm thick: a - Zn-containing white bronze, b - zinc-free white bronze. Figure 15 shows the results of X-ray phase analysis of zinc-containing white bronze. Peaks of the substrate α-brass (black), β-brass (green) and intermetallic compounds in the coatings - Cu6Sn5 (yellow) and Cu5Zn8 (blue) are visible.
Figure 15 - Simulated (solid red line) and experimental (dotted black line) X-ray diffraction patterns: a - zinc-containing, b - zinc-free bronzes. The presence of the Cu5Zn8 phase in zinc bronze is more difficult to prove, since its peaks strongly overlap the peaks of Cu6Sn5 and the brass substrate ((110) at 42.8o β-brass). Full structure analysis gives a crystallite size of 70 (±5) nm for zinc-containing bronze and 50 (±5) nm for zinc-free bronze (isotropic approximation). According to the results of XPS analysis, it was found that in zinc-containing bronze a significant proportion of tin on the surface was metallic, and zinc was in the form of oxides (Zn0 at 1021.8 eV, Zn oxide at 1022.1 eV).
Features of working with chrome-plated parts
During preparatory work and during the painting process, difficulties may arise with removing chrome, which is best rubbed with a special machine. Manual work will require diligence and a large supply of free time.
If you decide to transform the appearance of your car yourself and replace boring chrome parts with beautiful coal-black ones, then you should be patient and use high-quality materials. This process is quite lengthy, especially if you have to remove chrome from plastic yourself, but by following our recommendations, you will be able to do this job efficiently, and the effect will last a long time.